

Top Marketing KPI Dashboard Examples to Boost Your Strategy
Last Updated

Visualising Success: Why Marketing KPI Dashboards Matter
Want to transform your marketing data into a powerful engine for growth? This listicle provides eight practical marketing KPI dashboard examples to help you do just that. We'll dissect real-world dashboards, highlighting key metrics, layouts, and use cases tailored to various business needs. Whether you're an e-commerce retailer optimising PPC campaigns, a B2B company generating leads on LinkedIn, or a startup exploring risk-free advertising, this list has you covered.
We'll explore platforms like Google Analytics, HubSpot, Facebook Ads Manager, Salesforce Marketing Cloud, Google Data Studio, Klaviyo, Tableau, and SEMrush. This deep dive into marketing KPI dashboard examples goes beyond surface-level descriptions. We'll analyse the strategic thinking behind each dashboard's design, extracting actionable tactics you can replicate.
Discover how to:
- Identify the most impactful KPIs for your specific goals
- Visualise data effectively for clear, at-a-glance insights
- Transform raw data into informed marketing decisions
- Build dashboards that drive real business results
Stop sifting through mountains of data. Start visualising success with these powerful marketing KPI dashboard examples.
1. Google Analytics Marketing Performance Dashboard
A Google Analytics Marketing Performance Dashboard provides a comprehensive view of your website's activity, allowing you to track key metrics and understand how your marketing campaigns are performing. It's a crucial tool for any business with an online presence, offering real-time insights into website traffic, user behaviour, conversion rates, and attribution across multiple marketing channels. This makes it an essential element for data-driven digital marketing strategies. It's the backbone of understanding how your marketing efforts translate into tangible online outcomes.
Examples of Successful Implementation
- E-commerce Companies: Track product page performance to identify top sellers and understand where users drop off in the purchase funnel. This data informs inventory management, pricing strategies, and website optimisation efforts.
- SaaS Businesses: Monitor trial-to-paid conversion rates and identify friction points in the onboarding process. By analysing user behaviour during the trial period, SaaS companies can improve their product and messaging to boost conversions.
- Content Publishers: Analyse article engagement metrics like time on page, bounce rate, and social shares to understand which content resonates most with their audience. These insights can inform content strategy and editorial calendars.
Actionable Tips for Optimising your Dashboard
- Set up custom goals: Align these goals with specific business objectives, such as completing a purchase, signing up for a newsletter, or downloading a resource.
- Use UTM parameters: These allow for accurate campaign tracking by identifying the source, medium, and campaign name for each traffic source. Learn more about effective Google Ads conversion tracking here: Learn more about effective Google Ads conversion tracking.
- Create custom dashboards: Tailor dashboards to different stakeholder needs, such as a high-level overview for executives or a detailed performance report for marketing teams.
- Regularly audit and clean up goal configurations: Ensure goals remain relevant and accurately reflect your current business objectives.
Why Use a Google Analytics Marketing Performance Dashboard?
This dashboard is indispensable for understanding the effectiveness of your marketing campaigns. It offers the ability to connect marketing activities directly to website engagement and conversions. This data empowers you to make informed decisions, optimise campaigns in real-time, and ultimately drive better business outcomes. It's a powerful tool for any business seeking data-driven growth.
The following infographic illustrates the core process flow within a Google Analytics Marketing Performance Dashboard.
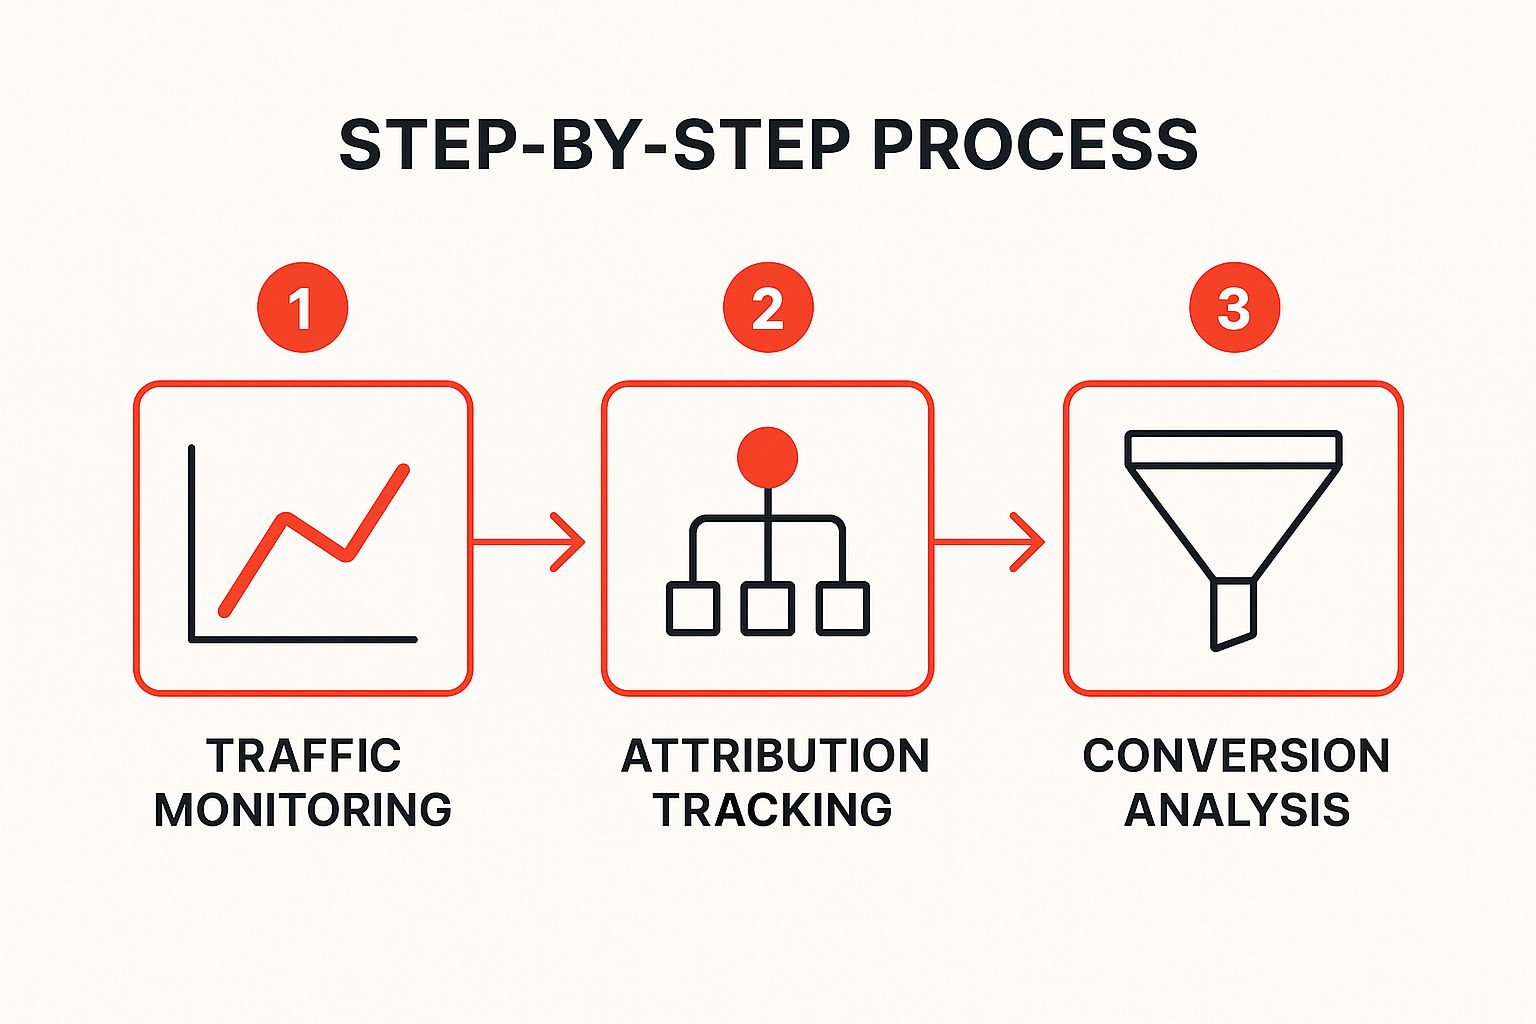
This infographic depicts the three key stages of analysis: Traffic Monitoring, Attribution Tracking, and Conversion Analysis. These stages, connected by a directional flow, demonstrate how data is collected, attributed, and then analysed for conversion effectiveness. The infographic underscores the importance of a holistic approach, highlighting how understanding the entire user journey, from initial website visit to final conversion, is crucial for optimising marketing performance.
2. HubSpot Marketing Hub Dashboard
A HubSpot Marketing Hub Dashboard is an all-in-one inbound marketing platform. It combines lead generation, email marketing, social media, and sales pipeline metrics within a single interface. Designed to track the entire customer journey, from initial contact to closed deal, it emphasises the inbound marketing methodology. This makes it a powerful tool for businesses focused on attracting, engaging, and delighting customers.

Examples of Successful Implementation
- B2B Companies: Track lead quality and sales handoffs, ensuring smooth transitions between marketing and sales teams. This data helps identify bottlenecks in the sales funnel and improve lead nurturing processes.
- Marketing Agencies: Manage multiple client campaigns from a centralised dashboard, streamlining reporting and optimising resource allocation across various projects. This allows for efficient management and clear performance tracking.
- Growing Startups: Scale inbound marketing efforts by automating key processes and tracking performance metrics. This facilitates rapid growth while maintaining a consistent and data-driven approach.
Actionable Tips for Optimising your Dashboard
- Align lead scoring with sales team input: Ensure marketing qualified leads (MQLs) align with sales team expectations to improve conversion rates and reduce friction.
- Use attribution reports to optimise budget allocation: Understand which marketing channels are driving the most valuable leads and allocate budget accordingly for maximum ROI.
- Set up automated workflows for lead nurturing: Automate email sequences, social media engagement, and other touchpoints to nurture leads effectively and move them through the sales funnel.
- Regularly review and update buyer personas: Keep your ideal customer profiles up-to-date to ensure marketing efforts remain targeted and resonate with your intended audience.
Why Use a HubSpot Marketing Hub Dashboard?
This dashboard provides a holistic view of your inbound marketing performance. It connects marketing activities directly to sales outcomes, allowing for data-driven decision-making and continuous improvement. This unified approach is essential for businesses seeking to build strong customer relationships and drive sustainable growth. It's a particularly valuable tool for businesses embracing the inbound methodology.
3. Facebook Ads Manager Dashboard
A Facebook Ads Manager Dashboard is a specialised social media advertising dashboard focused on Facebook and Instagram campaign performance. It provides detailed insights into ad spend, reach, engagement, and conversion metrics across Meta's family of apps. This makes it essential for understanding social media marketing ROI and crucial for any business leveraging these platforms for advertising. It's the central hub for managing, monitoring, and optimising your Facebook and Instagram ad campaigns.

Examples of Successful Implementation
- E-commerce Brands: Running dynamic product ads allows these brands to retarget website visitors with personalised product recommendations, boosting conversion rates and return on ad spend. Think of a fashion retailer showcasing previously viewed items directly within a user's Facebook feed.
- Local Businesses: Targeting specific geographic areas ensures that ads are shown only to relevant potential customers within a defined radius. A cafe, for example, can focus its ad spend on people living or working nearby.
- App Developers: Tracking install and engagement campaigns provides crucial data on user acquisition costs and in-app behaviour. This allows developers to refine their targeting and improve user retention strategies.
Actionable Tips for Optimising your Dashboard
- Use Facebook Pixel: This tool enables comprehensive conversion tracking, allowing you to understand which ads are driving valuable actions on your website. It's the foundation for effective campaign measurement.
- Test multiple creative formats and audiences: Experiment with different ad formats (image, video, carousel) and target various audience segments to identify what resonates best. This iterative approach helps optimise campaign performance.
- Monitor frequency: Keep a close eye on how often your ads are shown to the same users. High frequency can lead to ad fatigue and decreased effectiveness.
- Implement Conversions API: This advanced tool enhances attribution accuracy by directly sending conversion data from your server to Facebook, bypassing browser-based limitations.
Why Use a Facebook Ads Manager Dashboard?
This dashboard is indispensable for anyone advertising on Facebook or Instagram. It provides a granular view of campaign performance, allowing you to track key metrics, understand audience engagement, and optimise your ad spend. Learn more about Facebook Ads Manager Dashboard. This data-driven approach empowers you to make informed decisions and achieve your marketing objectives on these platforms. It's the key to unlocking the full potential of your Facebook and Instagram advertising efforts.
4. Salesforce Marketing Cloud Dashboard
A Salesforce Marketing Cloud Dashboard is an enterprise-grade marketing automation dashboard. It integrates various marketing channels, including email marketing, social media, mobile messaging, and web personalisation metrics. This provides sophisticated customer journey tracking and multi-touch attribution, particularly valuable for complex B2B sales cycles. It allows businesses to gain a holistic view of their marketing performance and understand the impact of different touchpoints on conversions.
Examples of Successful Implementation
- Fortune 500 Companies: These companies manage global campaigns with diverse audiences and intricate customer journeys. The Salesforce Marketing Cloud Dashboard helps them orchestrate complex marketing strategies and track performance across multiple regions and channels.
- Financial Services Firms: With stringent compliance requirements, financial services firms benefit from the platform's robust data management and security features. This ensures data integrity and adherence to industry regulations.
- Healthcare Organisations: These organisations can track patient engagement throughout their healthcare journey. From initial awareness campaigns to post-treatment follow-ups, the dashboard provides valuable insights into patient interactions.
Actionable Tips for Optimising your Dashboard
- Invest in proper training and certification: Maximise the platform's potential by ensuring your team understands its capabilities and best practices.
- Start with core modules before expanding: Focus on implementing and mastering the essential features before adding more complex functionalities.
- Establish clear data governance practices: Ensure data accuracy and consistency by implementing robust data management protocols.
- Leverage AI features for predictive insights: Utilise the platform's AI capabilities to anticipate customer behaviour and optimise campaign performance.
Why Use a Salesforce Marketing Cloud Dashboard?
This dashboard is particularly useful for businesses with complex sales cycles and a need for advanced marketing automation. It empowers marketing teams to gain a deeper understanding of customer behaviour, optimise campaigns based on data-driven insights, and ultimately improve return on investment. Learn more about optimising your attribution modelling with the Salesforce Marketing Cloud: Learn more about Salesforce marketing attribution. It's a powerful tool for businesses seeking to enhance customer engagement and drive revenue growth. It offers valuable insights into how different marketing activities contribute to conversions. This enables data-driven decision-making, allowing marketers to refine strategies and allocate resources effectively.
5. Google Data Studio (Looker Studio) Marketing Dashboard
A Google Data Studio (now Looker Studio) Marketing Dashboard provides a free and powerful way to visualise your marketing data. It connects to various data sources, allowing you to create custom dashboards that track key performance indicators (KPIs). Looker Studio excels at combining data from Google's marketing tools (like Google Ads and Analytics) with third-party platforms, giving you a comprehensive view of your marketing performance. This makes it ideal for creating shareable reports for stakeholders. It’s a valuable asset for demonstrating the impact of your marketing efforts.
Examples of Successful Implementation
- Marketing Agencies: Create client reporting dashboards that showcase campaign performance, ROI, and key metrics. This offers transparency and demonstrates the value the agency provides.
- Small Businesses: Combine data from multiple marketing sources, such as social media, email marketing, and website analytics, into a single dashboard. This provides a holistic view of marketing efforts without needing expensive enterprise-level tools.
- Marketing Teams: Share performance updates with leadership using visually appealing and easy-to-understand dashboards. This facilitates data-driven decision-making at all levels of the organisation.
Actionable Tips for Optimising your Dashboard
- Use templates: Looker Studio offers a range of pre-built templates to accelerate dashboard creation. These templates provide a solid foundation that you can customise to your specific needs.
- Implement consistent branding: Maintain a professional look by applying your brand’s colours and logo to your reports. This reinforces brand identity and creates a cohesive experience for viewers.
- Set up automated data refresh schedules: Ensure your data is always up-to-date by scheduling automatic refreshes. This saves you time and ensures stakeholders are accessing the latest information.
- Create different views for different stakeholder groups: Tailor dashboards to the specific needs of each audience. For example, executives might prefer a high-level overview, while marketing teams need more granular data.
Why Use a Looker Studio Marketing Dashboard?
Looker Studio empowers you to transform raw data into actionable insights. By visualising your marketing KPIs, you can easily identify trends, spot opportunities, and address challenges. This data-driven approach enables you to optimise campaigns, demonstrate ROI, and ultimately achieve better business outcomes. It's a powerful tool for any business seeking to improve marketing performance.
6. Klaviyo Email Marketing Dashboard
A Klaviyo Email Marketing Dashboard offers a sophisticated view of your email marketing performance, specifically tailored for e-commerce businesses. It goes beyond basic email metrics, tracking customer lifecycle stages, campaign performance, and revenue attribution. Its strength lies in leveraging behavioural triggers and segmentation based on purchase history and website activity. This allows for highly targeted email campaigns that resonate with individual customers. It's a powerful tool for driving sales and building lasting customer relationships.
Examples of Successful Implementation
- E-commerce Brands Tracking Abandoned Cart Campaigns: Identify customers who added items to their cart but didn't complete the purchase. Targeted emails reminding them of their items, offering incentives, or showcasing customer reviews can significantly improve conversion rates.
- Subscription Services Monitoring Retention Campaigns: Analyse subscriber behaviour and identify those at risk of churning. Proactive email campaigns offering exclusive content, discounts, or personalised recommendations can boost customer retention.
- Fashion Retailers Running Seasonal Promotional Campaigns: Segment customers based on past purchases and preferences. Send targeted emails showcasing new arrivals, offering exclusive discounts, or promoting seasonal collections relevant to their individual tastes.
Actionable Tips for Optimising your Dashboard
- Segment customers based on purchase behaviour: Create targeted segments based on purchase frequency, average order value, and product preferences to deliver more relevant and personalised emails.
- Use predictive analytics for churn prevention: Identify at-risk customers and proactively engage them with targeted retention campaigns.
- Test subject lines and send times regularly: A/B test different subject lines and send times to optimise open and click-through rates.
- Monitor deliverability metrics closely: Track bounce rates, spam complaints, and unsubscribe rates to ensure your emails reach the intended recipients.
Why Use a Klaviyo Email Marketing Dashboard?
This dashboard provides crucial insights into the effectiveness of your email marketing efforts. It connects email campaigns directly to revenue, allowing you to measure the ROI of your email marketing activities. By leveraging customer behaviour data, you can create highly targeted and personalised email campaigns that drive conversions and foster customer loyalty. It's an invaluable tool for any e-commerce business seeking to maximise the impact of their email marketing.
7. Tableau Marketing Analytics Dashboard
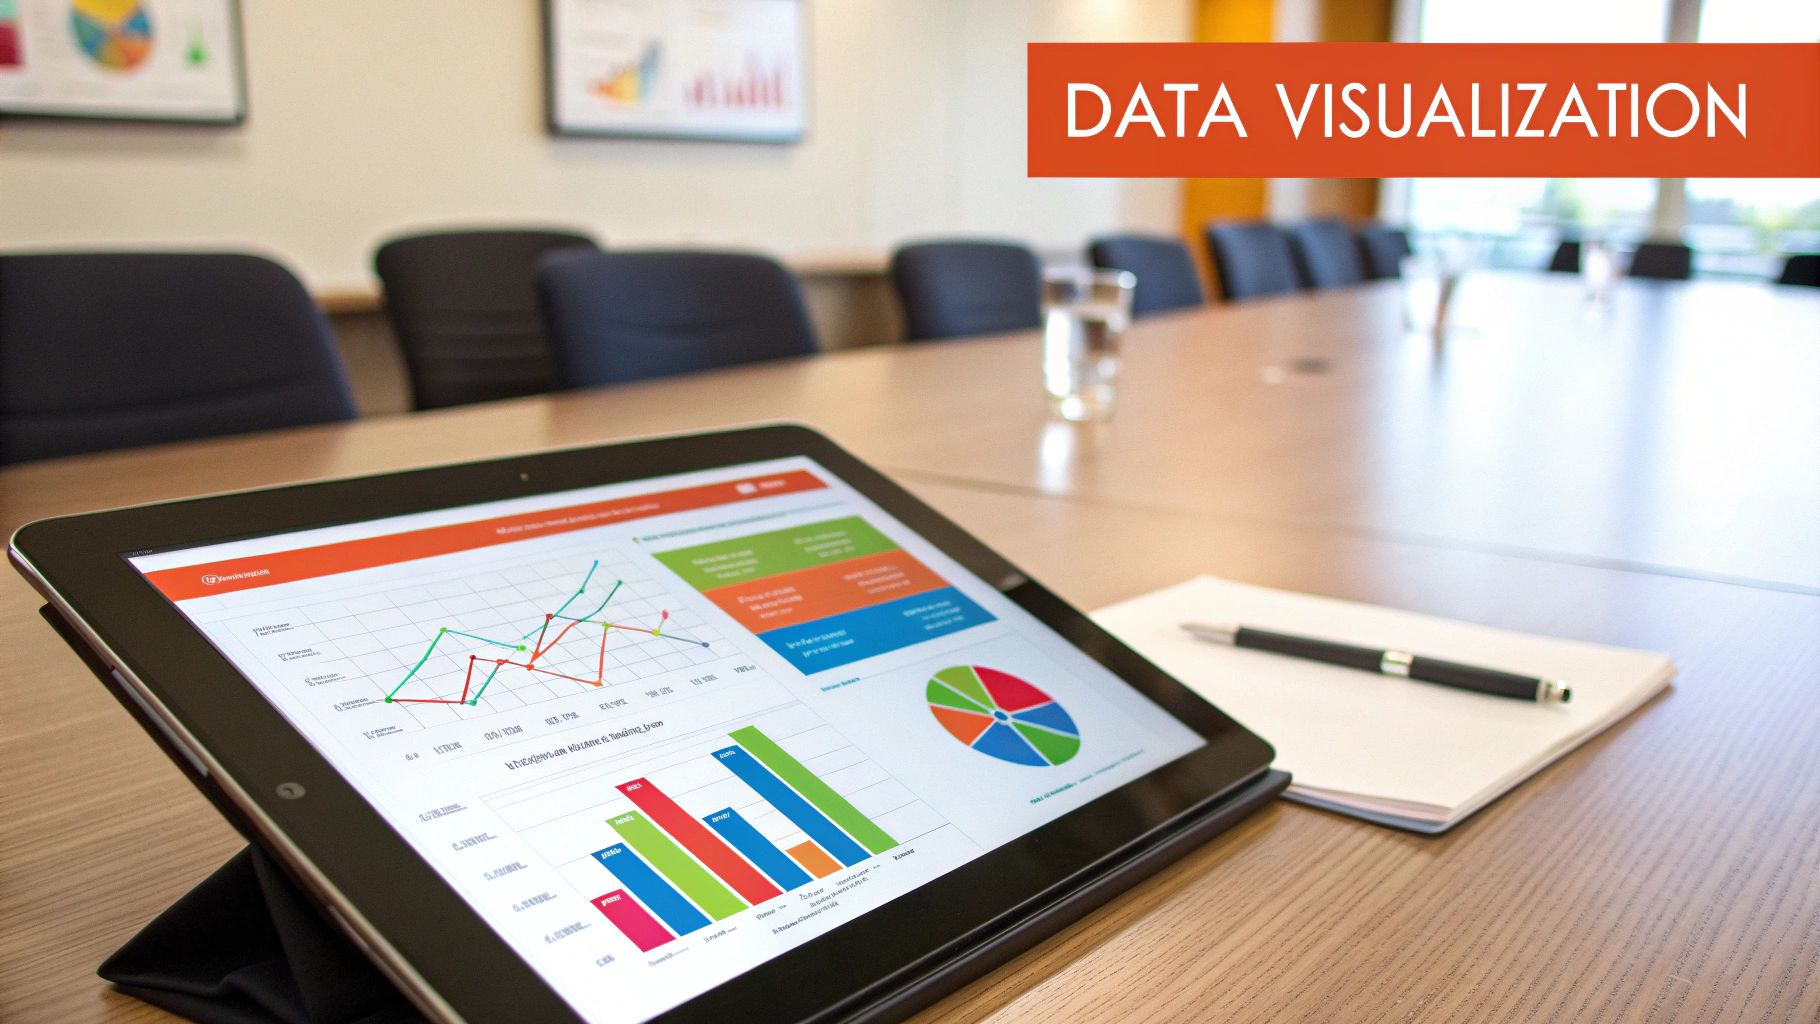
A Tableau Marketing Analytics Dashboard provides sophisticated marketing visualisations by connecting to multiple data sources. It excels at handling large datasets and creating interactive, drill-down reports, making it ideal for complex marketing attribution analysis. This powerful business intelligence tool allows marketers to uncover deep insights and optimise campaigns based on a comprehensive understanding of performance. It's a valuable asset for data-driven decision-making.
Examples of Successful Implementation
- Enterprise Companies: Analyse multi-touch attribution to understand the complex customer journey and allocate budget effectively across various channels. This helps optimise return on investment and improve overall marketing effectiveness.
- Marketing Teams: Perform cohort and retention analysis to identify high-value customer segments and develop targeted retention strategies. This data-driven approach can significantly increase customer lifetime value.
- Agencies: Create sophisticated client performance reports that showcase the impact of their marketing efforts. These visualisations provide clear, concise insights and demonstrate value to clients.
Actionable Tips for Optimising your Dashboard
- Invest in Tableau training and certification: This will empower your team to leverage the full potential of the platform and create advanced dashboards.
- Prepare and clean data before visualisation: Ensure data accuracy and consistency for reliable insights. This crucial step prevents misleading interpretations.
- Use parameters for interactive filtering: Allow users to explore data dynamically and gain deeper understanding of specific segments or time periods.
- Create dashboard stories for presentations: Communicate key findings effectively and engage stakeholders with compelling narratives.
Why Use a Tableau Marketing Analytics Dashboard?
This dashboard is essential for businesses that need to analyse large, complex datasets and gain a holistic view of their marketing performance. Its ability to connect to multiple data sources, create interactive visualisations, and perform sophisticated attribution analysis makes it a powerful tool for data-driven marketing. This empowers marketers to make informed decisions, optimise campaigns effectively, and drive significant business growth.
8. SEMrush Marketing Toolkit Dashboard
A SEMrush Marketing Toolkit Dashboard provides a comprehensive suite of tools for managing and analysing your digital marketing performance. It focuses on key areas like SEO, PPC, content marketing, and competitive intelligence. This powerful platform offers insights into organic search performance, paid advertising effectiveness, and competitor analysis, enabling you to develop and refine data-driven digital marketing strategies. Its all-in-one approach streamlines your workflow and provides a holistic view of your online presence.
Examples of Successful Implementation
- SEO Agencies: Track client search performance, monitor keyword rankings, and identify technical SEO issues to improve website visibility and organic traffic. This data allows agencies to demonstrate value and refine their SEO strategies for optimal client results.
- E-commerce Businesses: Monitor competitor pricing strategies, analyse product listing visibility, and identify opportunities to improve their own product pages. This competitive intelligence helps e-commerce businesses stay ahead of the curve and optimise their online sales strategies.
- Content Marketers: Analyse topic opportunities, research keyword trends, and assess content performance to create engaging and effective content that resonates with their target audience. These insights enable content marketers to develop a content strategy aligned with audience demand and search engine optimisation best practices.
Actionable Tips for Optimising your Dashboard
- Set up regular competitive monitoring alerts: Stay informed about competitor activity and identify potential threats or opportunities in real time.
- Use position tracking for key business keywords: Monitor your rankings for important keywords and understand how your SEO efforts are impacting your search visibility.
- Leverage content gap analysis for new opportunities: Discover content topics that your competitors are ranking for, but you aren't, and create high-quality content to fill these gaps.
- Combine organic and paid search insights: Gain a comprehensive understanding of your search marketing performance and identify opportunities to optimise both organic and paid campaigns.
Why Use a SEMrush Marketing Toolkit Dashboard?
This dashboard is essential for businesses seeking a comprehensive view of their digital marketing performance. It provides the tools and insights necessary to improve organic search rankings, optimise paid advertising campaigns, and stay ahead of the competition. The ability to integrate and analyse data from multiple marketing channels makes it a powerful asset for data-driven decision-making and achieving business objectives. The platform's comprehensive nature and user-friendly interface make it a valuable resource for businesses of all sizes.
Marketing KPI Dashboard Features Comparison
| Dashboard | Implementation Complexity 🔄 | Resource Requirements ⚡ | Expected Outcomes ⭐ | Ideal Use Cases 💡 | Key Advantages 📊 |
|---|---|---|---|---|---|
| Google Analytics Marketing Performance Dashboard | Moderate – steep learning curve for beginners | Low cost (free), moderate technical knowledge | High – real-time traffic and conversion insights | E-commerce, SaaS, content publishers | Free, extensive features, Google integration |
| HubSpot Marketing Hub Dashboard | Moderate to High – many features to manage | High cost, user-friendly for non-tech users | High – lead generation and inbound marketing | B2B companies, agencies, startups | Integrated CRM, automation, strong lead nurturing |
| Facebook Ads Manager Dashboard | Moderate – interface complexity for new users | Moderate technical skill, ongoing adaptation | High – social media ad performance and ROI | E-commerce brands, local businesses, app developers | Deep Facebook integration, advanced targeting |
| Salesforce Marketing Cloud Dashboard | High – enterprise scale and complexity | Very high cost, dedicated technical resources | Very high – multi-channel attribution and automation | Large enterprises, financial services, healthcare | AI features, deep CRM integration, automation |
| Google Data Studio Marketing Dashboard | Low to Moderate – manual setup required | Low cost (free), manual maintenance | Moderate – customized visualization and sharing | Agencies, small businesses, marketing teams | Free, highly customizable, collaborative |
| Klaviyo Email Marketing Dashboard | Moderate to High – advanced email features | Moderate to high cost, focused on e-commerce | High – e-commerce email performance and revenue | E-commerce brands, subscription services, retailers | Behavioral targeting, predictive analytics |
| Tableau Marketing Analytics Dashboard | High – steep learning curve and data prep | High cost, requires data expertise | Very high – detailed, interactive marketing analytics | Enterprises, marketing teams, analytics agencies | Exceptional visualization, handles big data |
| SEMrush Marketing Toolkit Dashboard | Moderate to High – many features and SEO focus | High cost, knowledge of SEO/PPC recommended | High – comprehensive SEO, PPC, competitor insights | SEO agencies, e-commerce, content marketers | Competitive intelligence, strong SEO/PPC tools |
Transforming Data into Action: Your Next Steps with KPI Dashboards
Throughout this article, we've explored a diverse range of marketing KPI dashboard examples, from industry giants like Google Analytics and HubSpot to specialised platforms like Klaviyo and SEMrush. Each platform offers unique strengths, catering to different business needs and marketing objectives. By analysing these real-world examples, we’ve uncovered key insights into how effective dashboard design, combined with the right metrics, can transform raw data into actionable strategies.
Key Takeaways for Australian Businesses
Whether you're an e-commerce retailer optimising your PPC campaigns, a B2B company generating leads on LinkedIn, or a startup exploring flexible advertising plans, the core principles of data-driven marketing remain the same. Here's a recap of the most crucial takeaways:
- Define your objectives: Before choosing a dashboard, clearly outline your specific marketing goals. What are you trying to achieve? Increased brand awareness? Higher conversion rates? More qualified leads? Your objectives will dictate the metrics you need to track.
- Choose the right metrics: Don't get bogged down by vanity metrics. Focus on the KPIs that directly impact your bottom line. Examples include website traffic, conversion rates, customer lifetime value (CLTV), and return on ad spend (ROAS).
- Visualise your data effectively: A well-designed dashboard should present data clearly and concisely. Use charts, graphs, and tables to highlight key trends and insights. Ensure the layout is intuitive and easy to navigate.
- Regularly review and refine: Your marketing KPI dashboard isn't a set-and-forget tool. Regularly review your data, analyse performance, and adjust your strategies accordingly. The marketing landscape is constantly evolving, so your dashboards should too.
The Power of Data-Driven Decisions
Mastering these concepts empowers you to make informed decisions, optimise your marketing spend, and achieve sustainable growth. By leveraging the power of data, you can identify what's working, what's not, and where to focus your efforts for maximum impact. This is particularly important in the competitive Australian market. Marketing KPI dashboard examples provide a practical framework for translating complex data into actionable insights.
From Insights to Action: Your Next Step
Effective marketing isn't just about collecting data; it's about using that data to drive meaningful change. By implementing the strategies and insights discussed in this article, you can transform your marketing efforts, gain a competitive edge, and achieve your business objectives.
For Australian businesses looking to harness the full potential of their marketing data, Click Click Bang Bang offers expert support in setting up, monitoring, and optimising your Google Ads and Meta Ads campaigns. We help you translate the insights from your marketing KPI dashboard examples into real-world results. Visit Click Click Bang Bang to learn more about how we can help you achieve your marketing goals.
Read NeXt
Or Read Our Latest
- How to Set Up Google Ads in Australia: Complete 2026 Guide
- Google Merchant Center Setup: The Complete 2026 Guide
- Business Manager Setup Facebook: The Complete 2026 Guide
- Google Ads Account Setup: Expert Guide for 2026
- Search Ads Optimisation: A Practical Guide for 2026
- Manual vs Automated Bidding for PPC Success
Click. CLick. Subscribe.
Get our best PPC insights, industry updates, and power moves delivered straight to your inbox. No fluff, just high-caliber strategies that actually work.
Don’t Leave Just Yet
Try Us For 30-Days,
Risk Free!!
We guarantee that you’ll love our work within the first 30 days, if not you’ll get your money back.
What have you got to lose?