PPC Conversion Rate Calculator: Boost Campaign Success
Last Updated

What Your PPC Conversion Rate Actually Reveals About Your Business
It's easy to get caught up in tracking clicks and impressions, but if you're not paying close attention to your PPC conversion rate, you're missing the most important part of the story. This single number is more than just a metric on your dashboard; it’s a direct health check on your entire marketing effort, showing how well your offer truly connects with your audience.
Your conversion rate tells you how persuasive you are. It’s the ultimate feedback on everything from your ad copy and targeting to the user experience on your landing page.
Beyond a Simple Percentage
Think of your conversion rate as a report card for your digital sales pitch. A high rate means your message, audience, and offer are all aligned. You're effectively speaking your customer's language and meeting their needs. On the flip side, a low rate is a clear warning sign that something is broken in that process. It could be weak ad copy, a confusing landing page, or a fundamental mismatch between what you're selling and who you're selling it to.
Using a PPC conversion rate calculator is a great first step, but the real work begins when you start interpreting that number. This metric is one of the most powerful diagnostic tools you have, pointing you exactly where to focus your efforts to make a real impact on your revenue.
As the data below shows, even the channel you choose can dramatically affect your results.
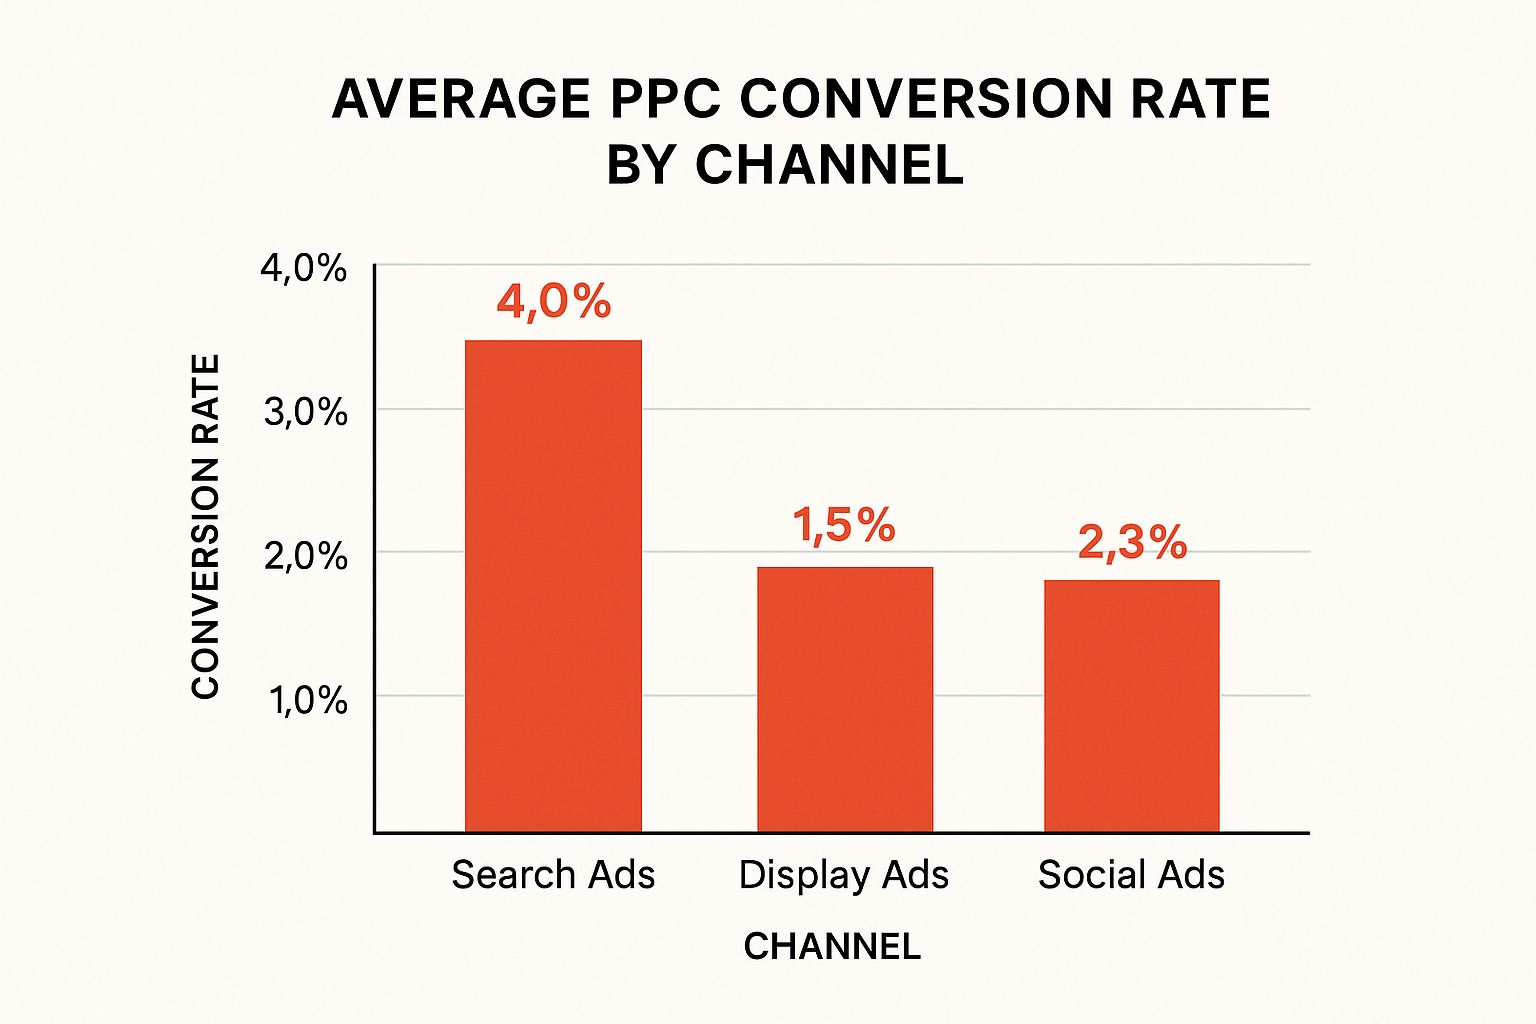
It’s no surprise that Search Ads convert at a much higher rate. This is because they capture users with high intent—people who are actively looking for a solution you might provide.
The Importance of Industry Context
Comparing your conversion rate to a generic, one-size-fits-all "good" number can be incredibly misleading. Context is everything, especially when looking at the diverse Australian market. Different industries have wildly different performance standards based on factors like customer intent, price, and competition.
To give you a better idea, here’s a look at how average PPC conversion rates can vary across different sectors in Australia. This can help you see where your business stands.
Australian PPC Conversion Rates by Industry
Comparison of average conversion rates across different Australian industries to help benchmark your performance
| Industry | Average Conversion Rate | Performance Level |
|---|---|---|
| Arts & Entertainment | 13.41% | Excellent |
| Finance & Insurance | 5.10% | Solid |
| Real Estate | 3.37% | Average |
| Apparel, Fashion & Jewellery | 1.57% | Competitive |
As you can see, the Arts and Entertainment industry can see amazing conversion rates above 13%, while the highly competitive Apparel, Fashion, and Jewellery space might see an average closer to 1.57%. A 2% conversion rate in fashion could be a great result, but that same number in entertainment would suggest there's room for improvement. You can dig deeper into these industry-specific figures to see how your business stacks up.
Your Own History Is the Best Benchmark
While industry averages are a useful guide, the most important benchmark is your own past performance. Tracking your conversion rate over time gives you a much clearer and more actionable picture of what's working. For instance, did your rate jump by 30% after you rewrote your ad copy? That’s a massive win, regardless of what anyone else in your industry is doing.
This internal benchmarking is powerful because it helps you:
- Pinpoint the specific changes that resonate with your unique audience.
- See how factors like seasonality affect your customer's buying habits.
- Set ambitious but realistic goals for your upcoming campaigns.
Ultimately, your conversion rate is your compass. It doesn’t just show you where you currently stand; it shows you the direction you need to head in to find genuine, sustainable growth for your business.
Collecting Data That Actually Tells The Truth
It’s easy to get excited about industry benchmarks, but those numbers are just a fantasy if your own data is a complete mess. A PPC conversion rate calculator is a fantastic tool, but it lives by one simple rule: garbage in, garbage out. Before you can find any meaningful insights, you need to be sure the clicks and conversions you’re feeding it are accurate. This isn’t about getting buried in spreadsheets; it’s about building a reliable system to capture the truth about your performance.
Nailing Your Conversion Tracking Setup
First things first, you have to decide what a "conversion" actually means for your business. For an e-commerce store, it's pretty straightforward—a sale. But for a B2B company, it could be a submitted contact form, a PDF download, or a phone call. Without this clarity, your data is just noise. Platforms like Google Ads and Meta Ads have tools designed to make this tracking process simple. You just need to create a conversion action that matches your specific business goal.
For example, you can track multiple different actions right inside your Google Ads account.

This dashboard lets you define and measure everything from online purchases to inbound calls, giving you a full view of how your campaigns are performing. This is so important because not all conversions are created equal. A high-value sale is worth far more than a newsletter signup, and your tracking should reflect that reality. Setting this up correctly from the start ensures your data is segmented and valuable from day one.
Avoiding Common Data Traps
Once your tracking is live, the work isn't over. You need to guard your data's integrity against common issues that can skew your results and lead you to make some pretty bad decisions. It’s a bit like being a data detective, always on the lookout for things that don't add up. I’ve seen campaigns tank because marketers overlooked these simple checks. Here’s what to watch for:
- Dodgy Bot Traffic: Automated bots love to click on ads, which drives up your click numbers without any possibility of a conversion. Be suspicious of any sudden spikes in clicks that come with a 0% conversion rate and use IP exclusion lists to block them.
- Mismatched Attribution Windows: An attribution window is the time frame after a click in which a conversion gets recorded. A 7-day window might be perfect for an impulse buy, but a business with a longer sales cycle might need a 30 or 90-day window to see the full picture.
- Ignoring the Full Journey: Many customers will do their initial research on a phone and then make the final purchase on a desktop later. If your tracking only gives credit to that last click, you’re missing a huge part of the story. Enable cross-device tracking to understand the entire customer journey.
Getting this clean data organized is the final piece of the puzzle. When your numbers are trustworthy, every calculation you run will point you toward real opportunities for growth.
Using Your PPC Conversion Rate Calculator Like A Pro
Alright, you’ve got your data cleaned up and ready. Now for the fun part: putting that PPC conversion rate calculator to work. This is about more than just finding one big number for your whole account. The real insight comes when you use it to dissect your campaigns, uncovering the stories hidden in the data and turning those numbers into a clear plan.
Beyond a Single Campaign Number
Knowing your campaign has an overall 4% conversion rate is a start, but it hides the most important details. The true power of a calculator is unleashed through segmentation. You need to run the numbers for individual ad groups, specific keywords, and even different devices to find out what’s really driving results.
Imagine a law firm in Melbourne sees a respectable 5% conversion rate across their account. Not bad. But once they start calculating rates for specific segments, the picture changes. They might find their "commercial litigation lawyer" ads convert at an incredible 9% on desktop, while "family law advice" ads on mobile devices are struggling at a dismal 2%.
This is the kind of insight that changes everything. It immediately shows them where to double down on budget (desktop ads for commercial law) and which areas need a completely different strategy or maybe even a pause (mobile ads for family law). Without this granular view, they’d be treating their best and worst performers exactly the same.
Accounting for Different Conversion Goals
Most businesses have more than one conversion goal. A roofer in Brisbane, for example, might track both "Request a Quote" form submissions and direct phone calls. A standard calculator would count both of these as a single conversion, but we know they aren't created equal. A phone call often represents a much more qualified, urgent lead.
This is where the concept of a weighted conversion rate becomes incredibly useful. Instead of just counting every conversion as "1," you assign a value based on its importance to your business.
If a phone call is twice as valuable as a form fill, you can adjust your calculations to reflect that. You might discover that while one ad group drives more total conversions through forms, another generates fewer but much higher-value phone calls, making it the actual top performer. You can create a simple version of this in a spreadsheet to get a much more accurate view of what’s driving profit, not just clicks and form fills.
From Calculation to Action
Running these detailed calculations is the first critical step. The numbers you generate provide the proof you need to make confident, data-backed decisions about your campaigns. It’s the difference between guessing what’s working and knowing for sure.
Every segmented and weighted calculation you perform helps sharpen your focus. It ensures your optimization efforts are aimed directly at the areas that will produce the biggest impact on your bottom line. Now, let's explore how to interpret these findings and turn them into action.
Decoding What Your Numbers Really Mean
So, you’ve plugged your numbers into a PPC conversion rate calculator and it’s given you an answer. Maybe it’s 3.5%, maybe it’s a solid 6%. But what does that single figure really tell you about your campaigns? Honestly, not much on its own. The real insights—the kind that lead to actual growth—come from digging deeper and understanding the story behind the numbers.

Segmenting for Deeper Insights
A single, account-wide conversion rate can be misleading because it averages out all the highs and lows. To find actionable information, you need to start slicing up your data into smaller, more meaningful segments. It's about looking past the campaign level and asking more specific questions about what drives user behaviour.
- Device: Are people converting more on desktop during work hours, or on mobile while commuting?
- Time of Day: Do you see a spike in conversions on weekday evenings or over the weekend?
- Location: Are customers in Melbourne out-converting those in Perth?
- Audience: How are your remarketing lists performing compared to brand new audiences?
Let's say you're a retailer selling high-end outdoor gear. You might find that ads targeting 35 to 55-year-olds on desktop computers are converting at a fantastic 8%. At the same time, ads shown to 18 to 24-year-olds on mobile are only hitting a 1.5% conversion rate. This doesn't mean you should kill the mobile campaign; it tells you exactly where your budget is working hardest and where you might need to adjust your messaging or landing page for a different audience.
Of course, getting this granular requires a rock-solid tracking setup. If you need a refresher on that, our guide to Google Ads conversion tracking can help you get everything in order.
Benchmarking PPC Against Other Channels
Your PPC campaigns don't exist in a vacuum. To truly understand their performance, you need to see how they stack up against your other marketing channels, especially SEO. In the Australian market, it's common for PPC to drive a huge amount of traffic—sometimes up to 50% more than organic search—thanks to its ability to target users with precision.
However, volume isn't the whole story. Let's look at a side-by-side comparison to see how these channels typically perform for Australian businesses.
PPC vs SEO Conversion Performance Comparison
Side-by-side comparison of conversion rates and traffic volume between PPC and SEO channels for Australian businesses
| Channel | Average Conversion Rate | Traffic Volume | Cost Per Conversion |
|---|---|---|---|
| PPC | B2C: 1.2% / B2B: 1.5% | Higher | Generally Higher |
| SEO | B2C: 2.1% / B2B: 2.6% | Lower | Generally Lower |
As you can see, while PPC can deliver a higher volume of traffic, SEO often produces a better conversion rate. For Australian businesses, SEO averages a conversion rate of 2.1% for B2C and 2.6% for B2B, which is noticeably higher than PPC's 1.2% and 1.5% respectively.
This doesn't mean one is better than the other; it highlights the need for a balanced strategy. You can use PPC for immediate, targeted pushes while building a long-term, high-converting organic presence. You can find more statistics on this dynamic to see how this plays out across different industries.
Spotting Trends and Taking Action
Finally, remember that analyzing your conversion data isn't a one-and-done task. The real value comes from monitoring performance over time to spot trends. Is one of your best campaigns slowly bleeding conversions week after week? That’s a red flag telling you to check for ad fatigue or maybe a new competitor who's shaking things up.
On the flip side, maybe you just A/B tested a new landing page and saw a sudden 25% jump in conversions. That’s not just a nice-to-have; it's a clear signal to roll out that winning page across the board as quickly as possible.
The trick is to learn how to separate minor, everyday fluctuations from statistically significant changes that demand action. This is how you move from just looking at data to making confident decisions that lead to measurable improvements in your campaigns.
Transforming Insights Into Campaign Wins
Getting accurate numbers from a PPC conversion rate calculator is the easy part. The real work—and where the money is made—is turning those numbers into smart decisions that actually improve your campaigns. Data on its own is just noise; it’s the changes you make based on that data that lead to real results.
Let's dig into how to translate those insights into profitable campaign adjustments.
Prioritising Your Optimisation Efforts
Staring at a dashboard packed with data can feel like analysis paralysis waiting to happen. The secret is to ignore the small stuff at first and focus on changes that will give you the biggest bang for your buck. Don't waste an afternoon on tiny bid adjustments if your landing page is the real problem.
Think of it like this: if an entire campaign has a terrible conversion rate, fiddling with individual keyword bids is like rearranging the deck chairs on the Titanic. The issue is much bigger. You need to look at the foundations: Is the offer compelling? Is the landing page clear and easy to use? Are you even targeting the right people?
On the other hand, if only one ad group is underperforming while the rest of the campaign is healthy, the problem is more localized. That’s when you should zoom in on things like keyword-to-ad relevance or ad copy that isn't connecting with that specific audience segment.
Tactics for Underperformers and Top Performers
You can't treat all your campaigns the same. You need one game plan for fixing the duds and a completely different one for scaling your winners.
It's a classic story: a campaign that was doing great last month suddenly takes a nosedive. Before you panic, put on your detective hat. The first place to look is the search terms report. Are you suddenly paying for a bunch of irrelevant clicks? Is your ad copy still speaking to what people are actually searching for? Often, a simple headline tweak to better align with search intent can bring a struggling campaign back from the brink.
For your star performers, just throwing more money at them isn't always the best strategy. Instead of just raising the budget, think about how you can clone that success. Could you expand your keyword list with more specific long-tail variations? Or, if you're seeing great results in Sydney, why not duplicate the campaign structure to target Melbourne and Brisbane?
Advanced Levers for Extra Growth
Once you've got the basics down, you can start pulling some of the more advanced levers to squeeze every last drop of performance out of your account. These are the tactics that give experienced marketers an edge.
-
Dayparting: Look at your conversion data by the hour and day of the week. You might discover that your ideal customer for high-end furniture mostly buys between 7 PM and 10 PM on weekdays. By setting positive bid adjustments for these peak times, you make sure your ads are front and centre when people are ready to purchase.
-
Device Bid Adjustments: Your data might reveal that mobile users click a lot, but 90% of your sales actually happen on a desktop. In this scenario, you could apply a negative bid adjustment to mobile traffic, saving that budget for the desktop users who are far more likely to convert.
-
Audience Layering: This is where you can get incredibly precise. By layering an in-market audience (like "Home & Garden") over your existing search campaign, you're telling Google to prioritize people who are not only searching your keywords but have also shown recent interest in buying similar products. It’s like adding a high-intent filter to your targeting.
Building a profitable PPC account is a process of making deliberate, data-backed improvements, not just reacting to daily fluctuations. By balancing quick fixes with a long-term strategy, you can keep your campaigns healthy and growing. To dive deeper into these concepts, feel free to check out our guide on Google Ads best practices.
Dodging The Calculation Mistakes That Cost You Money

Even the sharpest marketers can stumble over PPC calculations, accidentally turning a great tool into a source of bad decisions. A PPC conversion rate calculator is only as smart as the data and logic you feed it. Getting this wrong doesn’t just mess up your reports; it costs you real money by pointing your optimization efforts in the completely wrong direction.
One of the most common traps is failing to see the complete customer journey. It's surprisingly easy to misread signals like delayed conversions or cross-device behavior, which can completely throw off your numbers.
Misinterpreting The Customer Journey
Attribution is rarely a straight line from a single click to a final purchase. Let's imagine a Perth-based furniture store running a PPC campaign. They check their dashboard and notice their mobile conversion rate is awful, and the first instinct is to slash that part of the budget.
What they're missing is the bigger picture. Customers are browsing on their phones during their lunch breaks, then making the $2,000 purchase on their desktop computer at home later that evening. By using a standard "last click" attribution model, they would incorrectly give the desktop 100% of the credit for the sale. This makes the mobile campaign look like a total failure, when in reality, it was a critical first touch. Properly accounting for this cross-device path is vital for an accurate calculation.
Overlooking Technical and External Factors
Sometimes, the problem isn't with your strategy but with a technical hiccup. A broken tracking code, a faulty integration between platforms, or even data sampling inside Google Analytics can render your numbers meaningless. If you see a sudden, dramatic drop in your conversion rate, you should always investigate these technical culprits first.
External factors also have a huge impact. Did a major competitor just launch a huge sale? Did your website suffer from slow load times for a day? These events can temporarily tank your conversion rates. Similarly, a sudden wave of irrelevant clicks from a poorly targeted ad can crush your numbers. For a useful refresher, check out our guide on using negative keywords in Google Ads to keep your traffic clean and relevant.
Here are a few quick warning signs that your data might be compromised:
- A conversion rate that suddenly drops to 0% on a campaign that was performing well just yesterday.
- Sudden, massive spikes or drops in your metrics without any corresponding changes to your campaigns.
- Clear data discrepancies when comparing numbers between your ad platform and your analytics tool.
Your Complete PPC Conversion Rate Calculator Action Plan
Alright, you've crunched the numbers with a PPC conversion rate calculator, and you have the data. But raw data is just the starting point. The real value comes from turning those numbers into a repeatable system that consistently drives better results. This action plan is your guide to building that very system.
Building Your Reporting Rhythm
Finding the right reporting cadence is crucial. You don't want to overreact to every daily blip, but you can't afford to miss major trends. For most businesses, a weekly check-in works perfectly to spot big problems, while a deeper monthly analysis helps you see the bigger picture and make strategic moves.
One of the best ways to stay on top of things without living in your ad accounts is to set up automated alerts. For example, you can create a rule that notifies you if a key campaign’s conversion rate drops by more than 20% week-on-week, or if your cost per acquisition (CPA) suddenly spikes. This puts you on the front foot, allowing you to fix issues before they become expensive headaches.
The Continuous Improvement Cycle
True PPC success isn't about finding a single magic bullet; it's about a constant cycle of improvement. Think of it as a simple loop: you get the data, figure out the story it's telling, form a smart hypothesis on how to improve, and then test that idea. This structured approach stops you from making random, gut-feel changes and helps build real, lasting momentum.
Here’s a simple checklist you can use for a monthly performance review:
- Benchmark Performance: How does this month's conversion rate stack up against last month's? What about the same month last year? This context tells you if you're truly making progress.
- Segment and Isolate: Don't just look at the account average. Break your data down by campaign, device, and audience to find your biggest wins and most significant leaks.
- Investigate the 'Why': When you spot a major shift up or down, play detective. Was it a change you implemented, a new competitor, or a wider market trend?
- Formulate a Test: Based on your findings, create one clear hypothesis to test. For example, "I believe changing our landing page headline to focus on free shipping will increase conversions."
- Document and Act: Keep a simple log of what you discovered and the specific action you plan to take. Over time, this becomes an invaluable playbook of what works for your business.
Communicating Your Wins
Finally, getting good at sharing your results with your team or clients is a skill in itself. The key is to frame your findings around real business outcomes. Numbers on a spreadsheet are boring; business growth is exciting.
Instead of just stating, "The conversion rate went up by 15%," explain what that actually means for the business. Try this instead: "Our updated ad copy was so effective that it generated 15% more qualified leads for the exact same budget." This simple shift connects your hard work directly to what matters most: the bottom line.
This systematic process is what separates good campaigns from great ones. If you'd rather focus on running your business, our team lives and breathes this process every day. Let the experts at Click Click Bang Bang build and manage your precision-driven PPC campaigns for you. Find out more about our PPC services.
Read NeXt
Or Read Our Latest
- SEO Cost Australia 2026: Your Guide to Pricing
- Offline Conversion Tracking: Guide for AU Businesses 2026
- How to Start Advertising on LinkedIn: 2026 Guide
- 7 B2B LinkedIn Ad Examples to Steal in 2026
- 7 Best Google Ads Managers in Australia for 2026
- Customer Data Platform Guide: Boost ROI & Meet AU Privacy
Click. CLick. Subscribe.
Get our best PPC insights, industry updates, and power moves delivered straight to your inbox. No fluff, just high-caliber strategies that actually work.
Don’t Leave Just Yet
Try Us For 30-Days,
Risk Free!!
We guarantee that you’ll love our work within the first 30 days, if not you’ll get your money back.
What have you got to lose?