

What Is the Average Ecommerce Conversion Rate?
Last Updated

Right then, let's talk about one of the most important numbers in your ecommerce business: the average ecommerce conversion rate. Here in Australia, that figure currently sits at 1.78%. This number is your yardstick, a crucial benchmark that shows you how well you're turning casual website visitors into actual paying customers.
Understanding the Ecommerce Conversion Rate
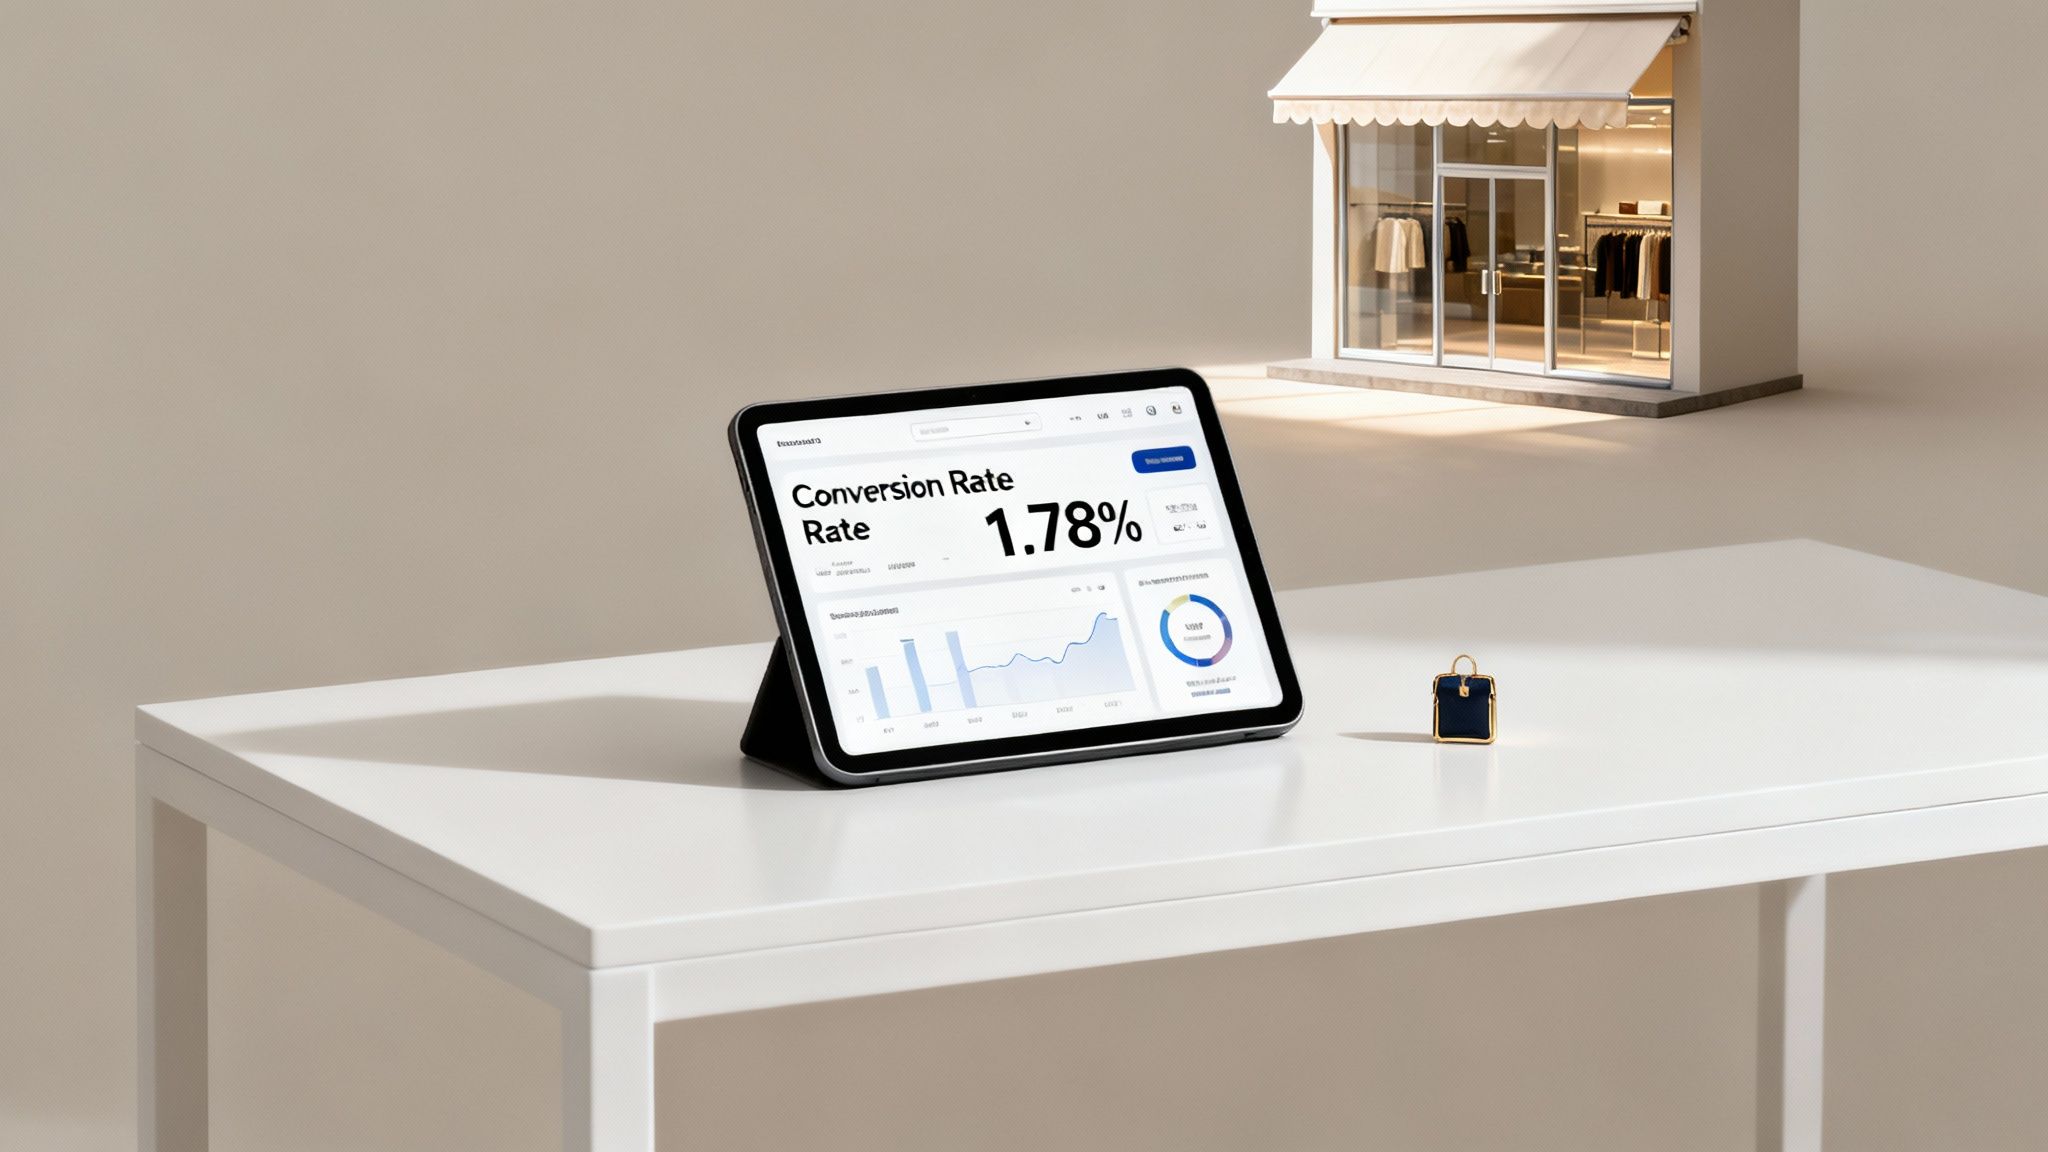
Imagine your online store is a physical shop on the high street. Every person who lands on your website is like someone walking through the front door. Your ecommerce conversion rate is simply the percentage of those people who end up buying something before they leave.
It's the ultimate measure of your store's performance.
If 100 people browse your site and only one makes a purchase, your conversion rate is 1%. This single metric tells you so much about the health of your business—it reveals how well your products, pricing, and the overall user experience are clicking with your audience.
The Australian Market Snapshot
Knowing the national average gives you some much-needed context for your own store's numbers. Let's take a quick look at where the Australian ecommerce market stands.
| Australian Ecommerce Market Snapshot | |
|---|---|
| Metric | Statistic |
| Average Ecommerce Conversion Rate (AU) | 1.78% (as of Sep 2024) |
| Global Average Ecommerce Conversion Rate | 1.88% |
| Annual Revenue (2024) | AU$56.07 billion |
| Active Monthly Users | 17.08 million |
As you can see, the Aussie average of 1.78% is just a fraction below the global figure of 1.88%. It reflects the competitive and often challenging market local retailers operate in. But despite that, the sector is an absolute powerhouse, generating a massive AU$56.07 billion in revenue and serving over 17 million users every month.
To calculate this powerful metric for your own store, the formula is beautifully simple:
(Total Number of Sales / Total Number of Website Visitors) x 100 = Conversion Rate %
So, if your store had 5,000 visitors and clocked 75 sales in a month, your conversion rate would be 1.5%. This little calculation is your starting point for understanding performance.
Why This Metric Is So Important
Tracking your conversion rate is about so much more than just crunching numbers; it’s about getting real, actionable insights into your business. A low or falling rate can be an early warning sign that something’s not right, while a high or improving rate is proof that your strategies are hitting the mark.
It helps you:
- Pinpoint Friction Points: A low rate often points to a snag in the customer journey, like a clunky checkout process, hidden shipping costs, or painfully slow page load times.
- Measure Marketing ROI: It shows you how well your marketing campaigns are attracting genuine buyers, not just window shoppers.
- Set Realistic Goals: Benchmarking against the average ecommerce conversion rate helps you set achievable targets for growth instead of chasing vanity metrics.
Ultimately, this one number tells a story about your customer's experience. To get the story right, you need accurate data, and the first step is setting up solid website conversion tracking.
How Australian Conversion Rates Have Shifted Over Time
Looking at the current average ecommerce conversion rate is a bit like checking the weather today—it's useful, but it doesn't tell you the whole story of the climate. That number, 1.78%, is just the latest chapter in a long history shaped by technology, consumer trust, and massive global events that have completely changed how we shop online in Australia.
A Walk Through the Past
Let's rewind to the early 2000s. Online shopping was still a novelty, and a lot of Aussies were pretty hesitant to jump in. Between widespread security fears and websites that were a nightmare to navigate, conversion rates were understandably low, hovering somewhere between 1.5% and 2.5%. Honestly, making a purchase online back then felt like a real leap of faith.
The Rise of User-Friendly Experiences
The 2010s were a massive turning point. Websites started getting slicker and much easier to use, which naturally boosted consumer confidence. Secure payment gateways became the norm, return policies got clearer, and shipping times got shorter—all the little things that dismantled the big barriers of the early internet.
During this decade, conversion rates started a steady climb, often landing between 2.5% and 4.0%. Shoppers got comfortable with buying online, and the retailers who poured effort into creating a smooth, trustworthy experience were the ones who cashed in. This was the era that laid the groundwork for modern ecommerce, cementing convenience and trust as non-negotiables.
Then, the pandemic hit and threw fuel on the fire. With physical stores shuttered, online shopping went from a choice to a necessity. This pushed conversion rates to a temporary peak of 3.0%-4.2% as millions of new shoppers were forced online. For a deeper dive into this historical data, check out SpeedCommerce's analysis of ecommerce benchmarks.
After that wild surge, things began to settle. The recent drop back to an average of 1.78% isn't a sign of failure; it's a sign of a more mature, competitive market. The digital window shoppers are back in full force.
This history lesson is crucial. It shows us that while consumer habits have changed for good, the initial "I have no other choice" urgency has faded. Today, just having an online store isn't going to cut it. If you want to thrive in this new environment, you need to learn how to actively improve conversion rates. Constant optimisation isn't just a good idea anymore—it's essential for survival.
Benchmarking Your Performance with Industry Averages
Knowing the national average ecommerce conversion rate sits around 1.78% is a decent starting point, but it's just that—a start. A "good" average ecommerce conversion rate is all about context.
For a store selling high-end, bespoke furniture, a 1% conversion rate could be phenomenal. On the other hand, a fast-fashion brand might see 1% as a clear sign of trouble.
True insight comes from looking beyond the national average and comparing your performance to businesses in your specific niche. Different industries have wildly different customer journeys, price points, and buying cycles, which all shape what a realistic conversion rate actually looks like.
Why Industry Context Is Everything
Think about the buying process for a new pair of socks versus a new sofa. One is a low-cost, almost thoughtless decision. The other might involve weeks of research, measuring your living room, and getting the whole family to agree. It’s no surprise their conversion rates are worlds apart.
This is exactly why benchmarking against your direct competitors is so important. It helps you set achievable goals and get a real handle on the unique challenges and opportunities within your market. To see where you stand, it's always a good idea to consult the latest ecommerce conversion rate benchmarks.
Your conversion rate isn't just a number; it's a reflection of how well your business model aligns with customer expectations in your specific industry. Comparing your performance to unrelated sectors can lead to unrealistic targets and misguided strategies.
This line graph gives you a snapshot of how Australian ecommerce conversion rates have shifted over the years, from the early adoption days in the 2000s to the far more mature market we see today.
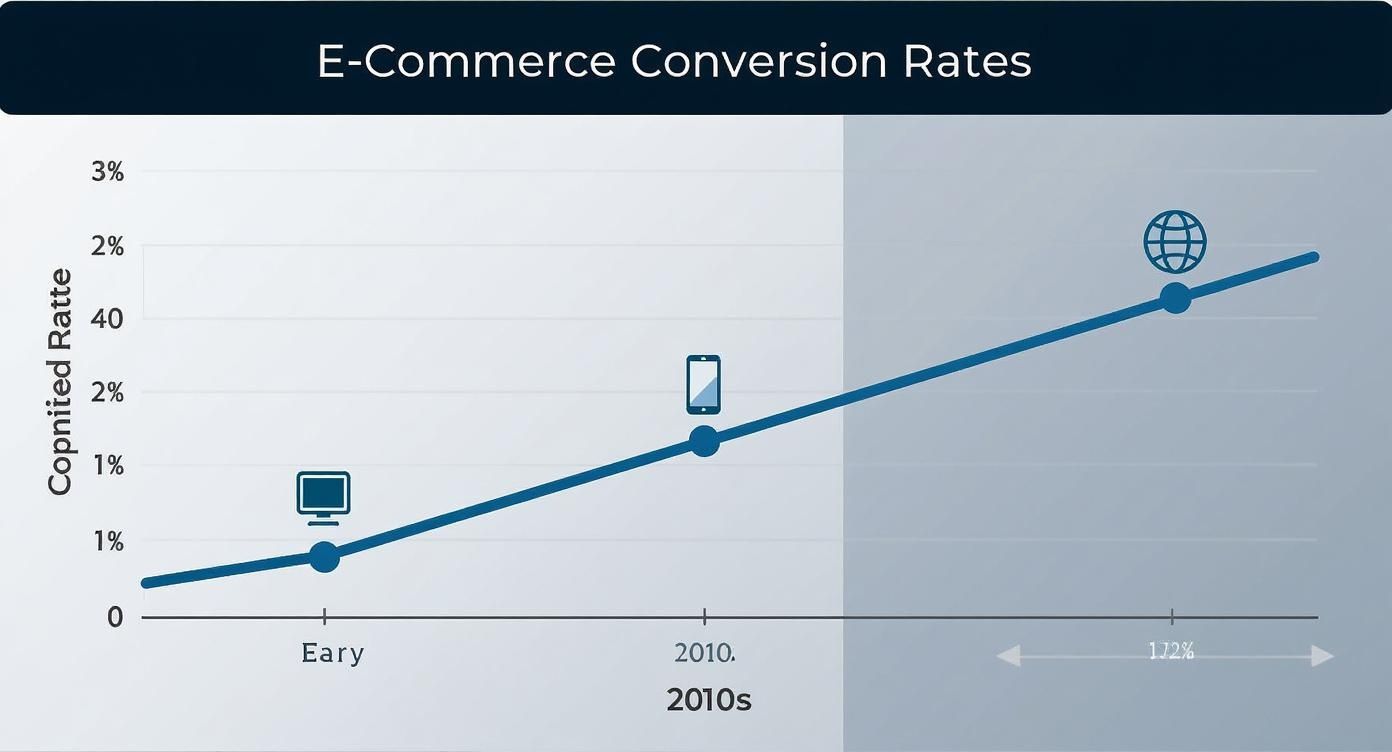
The data tells a clear story. After a period of solid growth and a massive surge driven by the pandemic, the market has settled. We're now in a more competitive phase where fine-tuning and optimisation are absolutely key to success.
Australian Ecommerce Conversion Rates by Industry
When you zoom in on different industries in Australia, you can see just how much these numbers can vary. This table breaks down some of the key sectors, showing the dramatic differences in what's considered a "normal" conversion rate.
| Industry | Average Conversion Rate (%) | Mobile Share (%) |
|---|---|---|
| Food & Beverage | 6.26% | 72% |
| Arts & Crafts | 5.2% | 68% |
| Home & Furniture | 4.94% | 65% |
| Fashion | 3.57% | 75% |
| Pet Care | 3.41% | 70% |
| Multi-Brand Retail | 2.34% | 69% |
| Luxury Goods | 1.46% | 62% |
Source: Adapted from industry reports by Rocking Web and similar Australian market analyses.
As you can see, the gap between the top performers and the rest is significant, which underscores why a one-size-fits-all approach to optimisation just doesn't work.
Let’s quickly break down why these numbers vary so much:
- High-Frequency Purchases: Industries like Food & Beverage (6.26%) get a huge boost from repeat business and urgent needs. When you need groceries for dinner tonight, you buy them without much hesitation.
- Passion-Driven Buys: The Arts & Crafts sector (5.2%) taps into hobbies and creative passions, which often means you're dealing with more committed and decisive buyers.
- High-Consideration Products: Luxury Goods (1.46%) naturally have lower rates. A high price tag means a much longer decision-making process, often involving multiple website visits, research, and deliberation before someone finally clicks "buy".
Understanding these dynamics helps you paint a much clearer picture of your own performance. Once you have these benchmarks in place, the next logical step is tracking them effectively. Our guide to marketing KPI dashboard examples can show you how to visualise your data and monitor your progress against the right industry standards.
The Core Factors That Influence Your Conversion Rate
Simply knowing the average ecommerce conversion rate is a bit like knowing the average temperature; it’s a nice-to-know, but it doesn’t tell you why your store feels freezing cold or scorching hot. To really understand what’s going on, you have to dig into the specific elements that are either encouraging sales or actively pushing potential customers away.
Think of your website as a physical sales funnel. A high conversion rate means that funnel is wide, smooth, and guides visitors effortlessly towards a purchase. A low rate, on the other hand, suggests there are leaks, cracks, and friction points all over the place, bleeding customers at every single stage.
Let's break down the most common culprits.
The User Experience Journey
The overall feel and flow of your website is, without a doubt, one of the biggest factors. A clunky, confusing, or slow site is the digital equivalent of a messy shop with broken shelves and rude staff. No one wants to stick around.
Key elements of user experience (UX) that make or break a sale include:
- Site Speed: Every second counts, literally. If your pages take an eternity to load, especially on mobile, visitors will bounce before they even see what you're selling.
- Easy Navigation: Can shoppers find what they’re looking for intuitively? A confusing menu or a useless search function is a recipe for instant frustration.
- Mobile Optimisation: With a massive chunk of traffic coming from mobile devices, a site that isn’t built for smaller screens is basically turning its back on a huge amount of money.
A seamless user experience isn’t a luxury; it’s the foundation of trust. If a visitor struggles to even browse your site, they won’t have the confidence to hand over their credit card details.
For instance, a fashion retailer with a slow-loading lookbook or a checkout process that requires ten clicks on a tiny screen will see a much higher cart abandonment rate than a competitor with a zippy, mobile-first design.
Product Page Power and Persuasion
Your product pages are your digital salespeople. This is the exact spot where a casual browser decides to become a buyer, so every single detail matters. A weak product page fails to build desire or answer crucial questions, leaving shoppers uncertain and ready to click away.
Think about the difference between a page that just lists a product's name and price versus one that tells a compelling story. The best product pages are a mix of art and science.
To diagnose your own, ask yourself:
- High-Quality Visuals: Are your images and videos clear, detailed, and professional? Shoppers can't touch the product, so your visuals have to do all the heavy lifting.
- Compelling Descriptions: Does your copy go beyond basic specs? It should scream benefits, solve problems, and connect with what the customer actually needs.
- Social Proof: Reviews, ratings, and testimonials are absolutely vital. Nearly 95% of customers read reviews before making a purchase, making them one of the most powerful trust signals you can possibly have.
Trust Signals and Checkout Friction
Finally, even if a customer loves a product, they can still bail at the final hurdle. This almost always comes down to two things: a lack of trust or a frustrating checkout process.
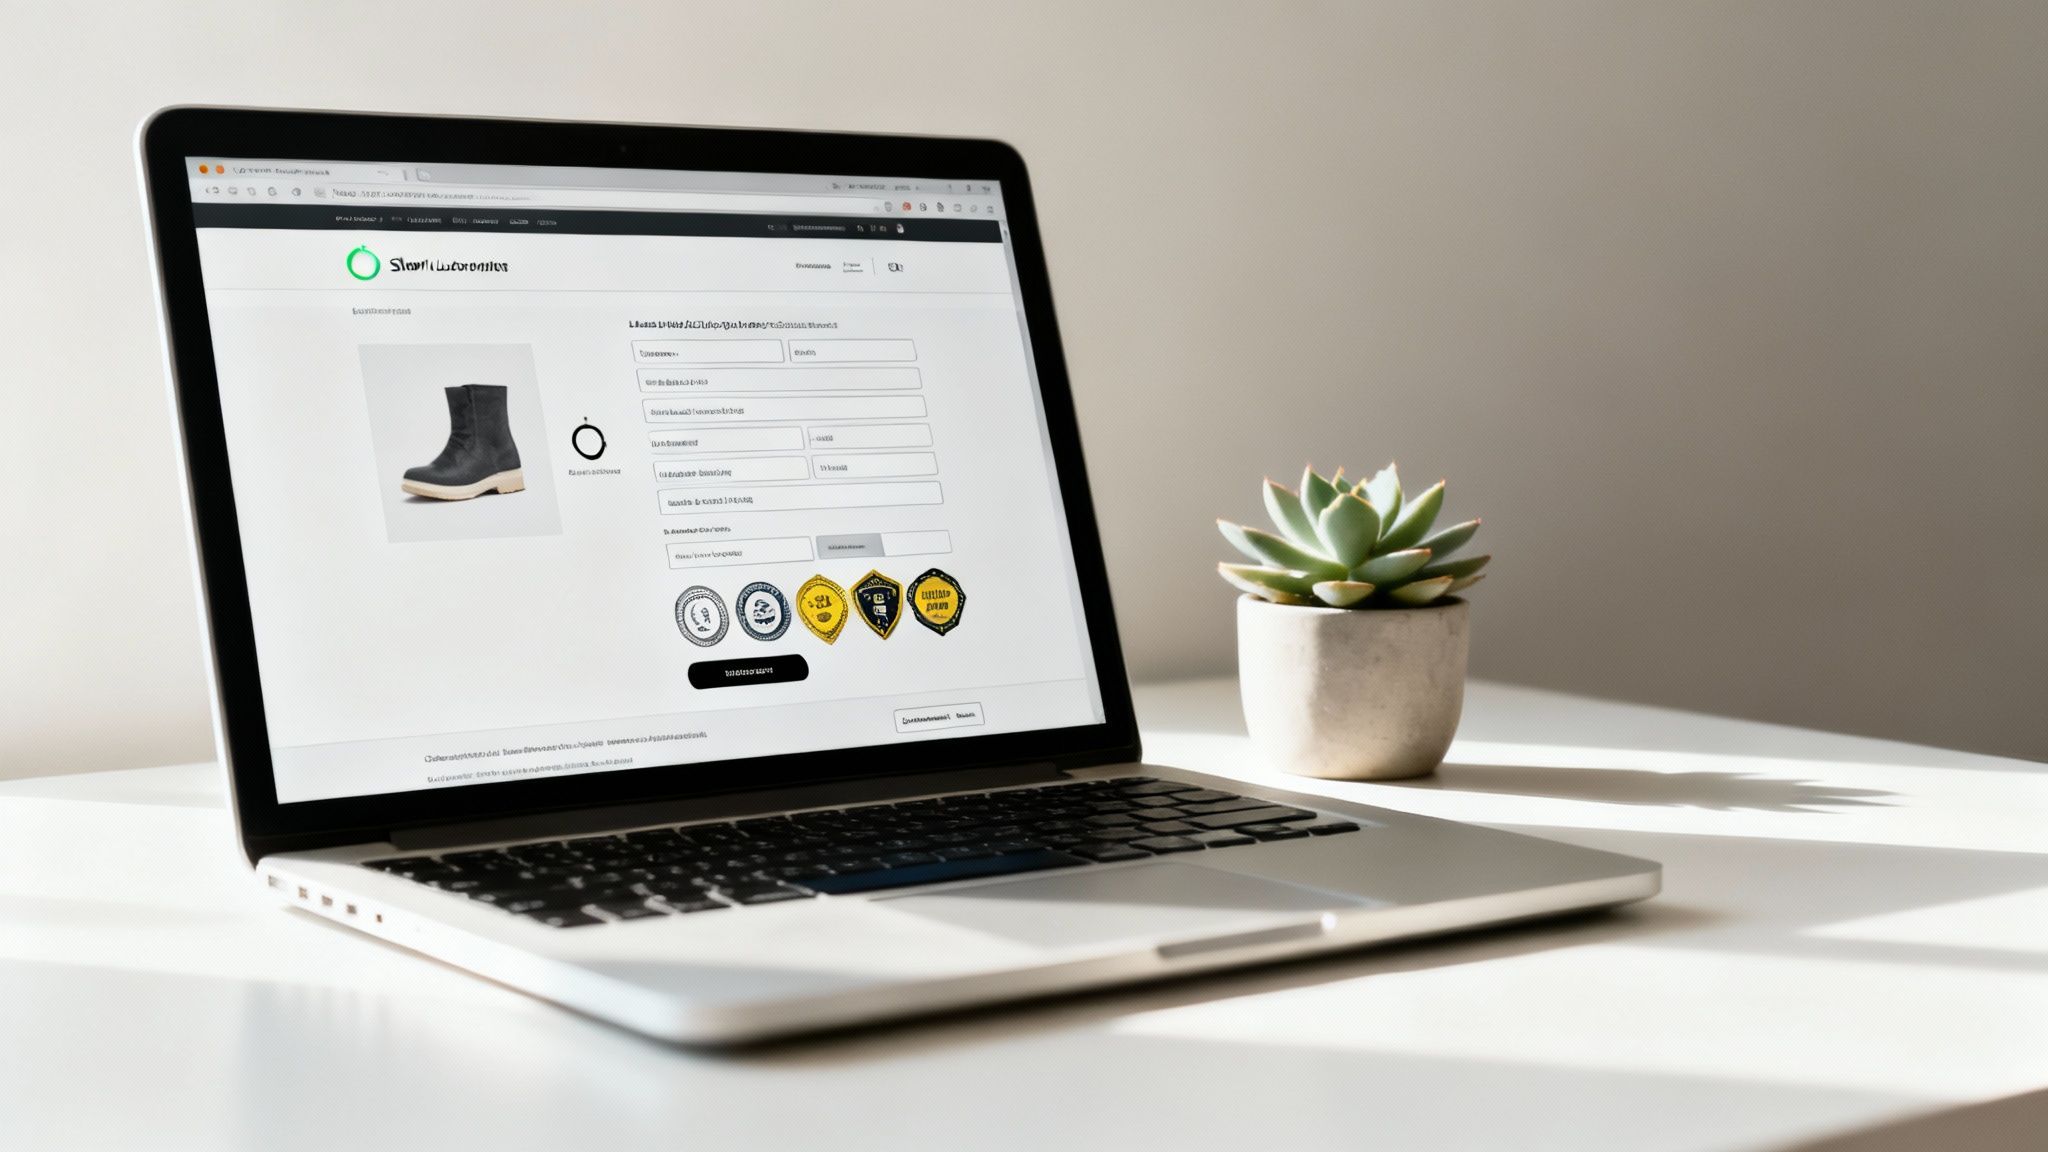
Think of the checkout as the final handshake. If it feels awkward or insecure, the deal can fall through in a second. Surprise shipping costs, being forced to create an account, or not seeing familiar payment options like PayPal or Afterpay are notorious conversion killers.
Building trust means displaying security badges, having a crystal-clear returns policy, and being completely transparent about all costs upfront. By removing these last-minute doubts and obstacles, you create a smooth path from interest to purchase, which directly boosts your conversion rate.
Actionable Strategies to Boost Your Conversions
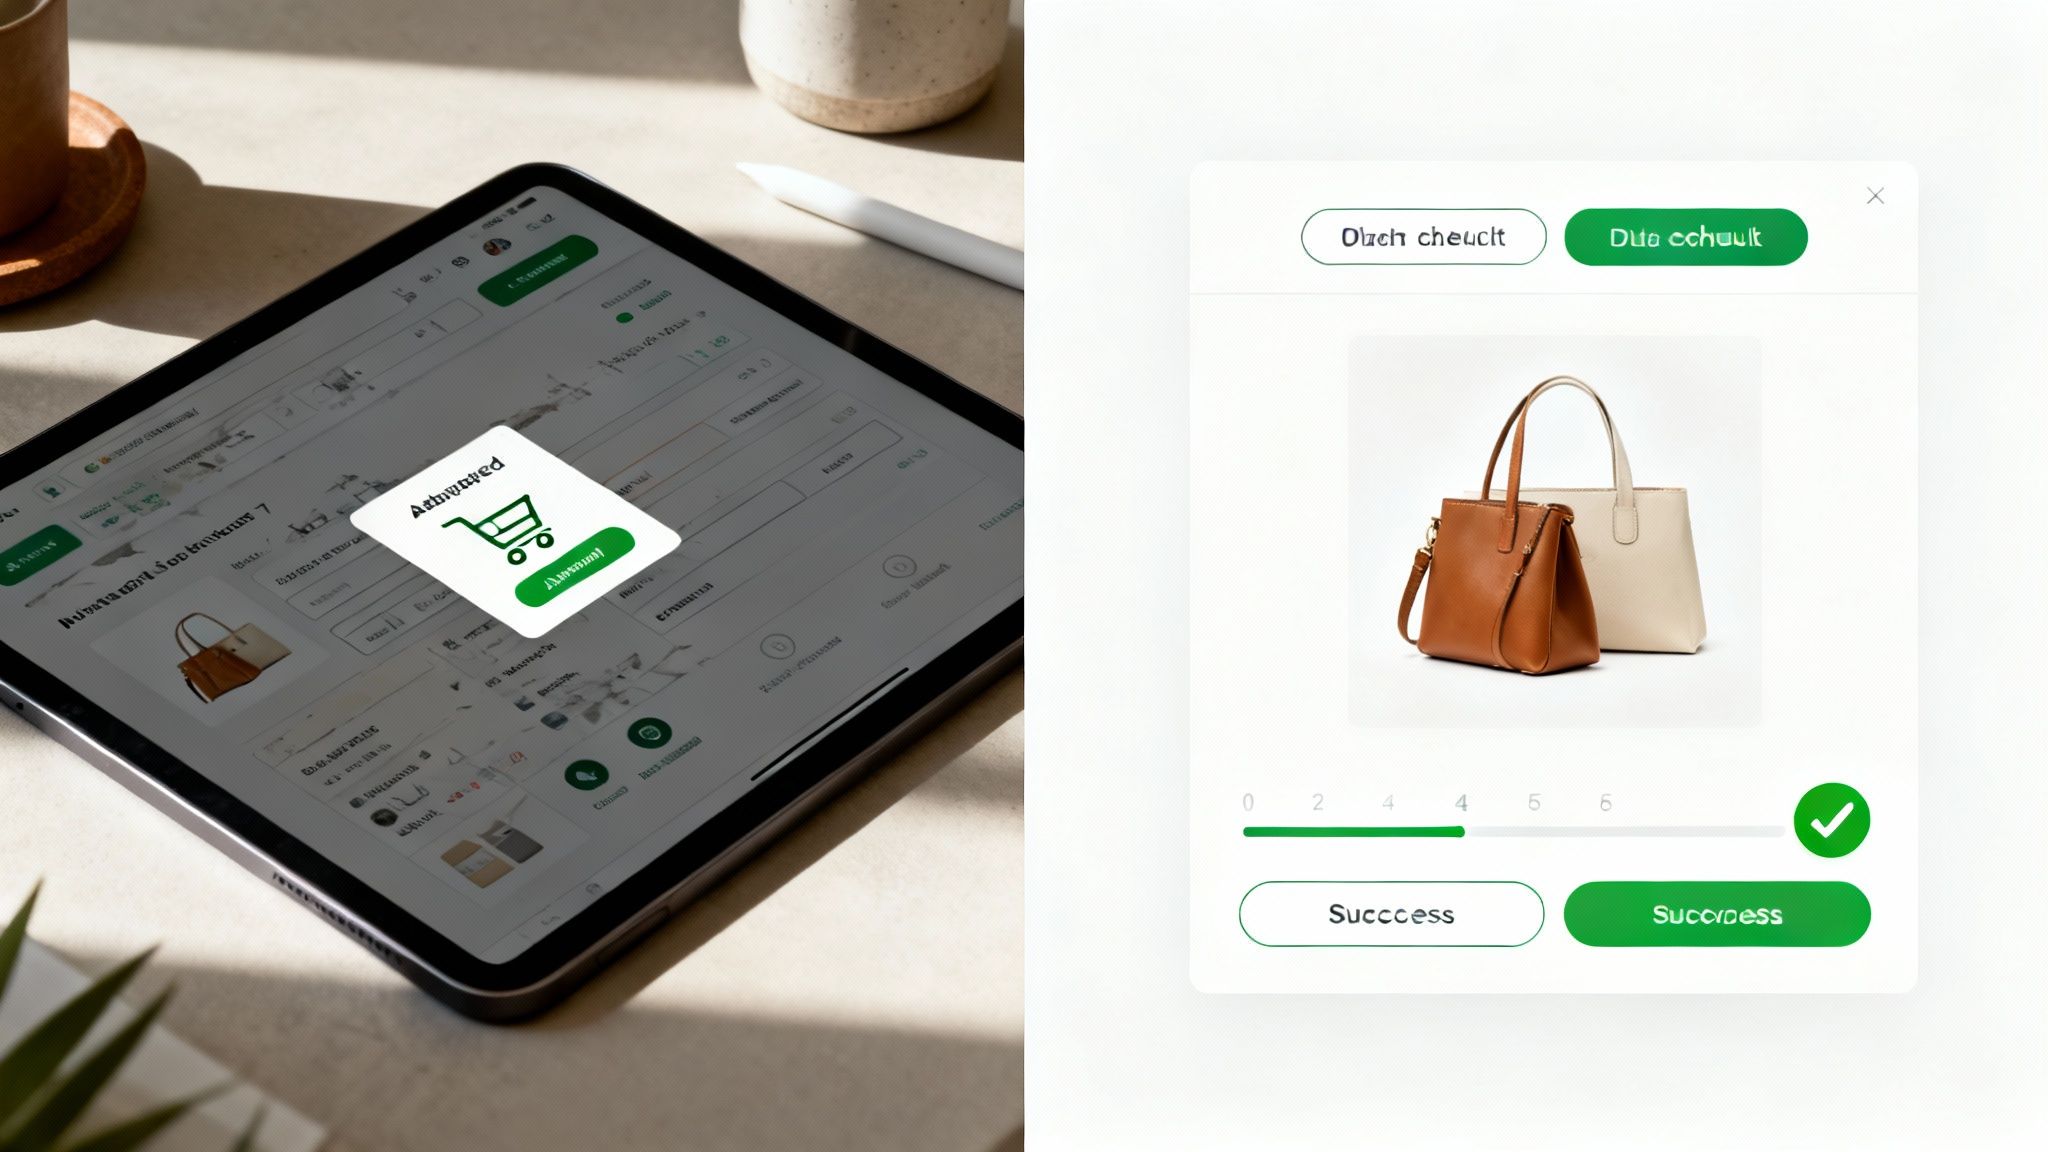
Knowing your numbers is one thing, but actually improving your average ecommerce conversion rate is where the real work begins. Let’s move past the theory and dive into a practical playbook of tactics you can use to turn more of your browsers into buyers.
It’s all about making small, deliberate changes that snowball into a significant impact.
Each of these strategies is designed to smooth out a specific friction point in the customer journey, from the second they land on your site to that final click at checkout. By tackling these areas one by one, you can build a more persuasive experience that naturally encourages people to buy.
Master Your Product Pages
Think of your product pages as the heart of your online store. They have to do more than just show a product; they need to spark desire, answer unspoken questions, and build a rock-solid sense of confidence. If they fall flat, so will your sales.
Start with your visuals. Since your customers can't physically pick up the item, your photos and videos have to do all the heavy lifting.
- Use High-Resolution Imagery: Show off your product from every angle with crisp, high-quality photos. Don't forget to include lifestyle shots showing it in use. A zoom feature is non-negotiable.
- Incorporate Video: A quick video demo can boost engagement like nothing else. It answers questions that static images just can’t, showing the product in action.
- Write Compelling Copy: Your product descriptions should focus on the benefits, not just the features. How does this product solve a problem or make your customer's life better? Tell that story.
Beyond the visuals, your most powerful weapon for building trust is social proof. Nearly 95% of shoppers read customer reviews before buying, so make sure they are front and centre.
Streamline Your Checkout Process
A clunky or confusing checkout is the number one killer of conversions. Every extra field, every unexpected cost, is another reason for a potential customer to walk away. Your goal is to make the journey from cart to confirmation completely frictionless.
Think of it like an express lane at the supermarket—it needs to be fast, simple, and predictable.
To get there, focus on simplicity and transparency. Offering a guest checkout option is a must, as forcing people to create an account is a massive turn-off for new buyers.
A seamless checkout isn't just about convenience; it's about maintaining the trust you've built. Unexpected shipping costs or a lack of familiar payment options can shatter that trust at the final moment.
You also need to show all costs upfront, including shipping and taxes, to avoid any nasty surprises. And be sure to offer multiple payment options like PayPal, Afterpay, and all major credit cards to cater to everyone's preferences and boost their confidence.
Run Effective A/B Tests
You don't have to guess what works. A/B testing, or split testing, is a data-driven way to compare two versions of a webpage to see which one performs better. It takes the guesswork out of your optimisation efforts.
You can test just about any element on your site, but here are a few great places to start:
- Headlines: Try out different value propositions to see which one grabs the most attention.
- Call-to-Action (CTA) Buttons: Experiment with the button's colour, text ("Buy Now" vs. "Add to Cart"), and placement on the page.
- Page Layout: Test different arrangements of your images, descriptions, and customer reviews.
By changing one thing at a time and measuring the results, you can systematically improve your site’s performance. To dive deeper into optimising your user experience and checkout flow, check out these proven strategies to increase ecommerce conversion rate.
Got Questions About Ecommerce Conversion Rates? We’ve Got Answers.
Diving into the world of ecommerce analytics can throw a lot of questions your way. This quick guide tackles some of the most common queries we hear, giving you clear, straightforward answers to help you make sense of what the average ecommerce conversion rate means for your store.
What’s a Good Conversion Rate for a New Store?
For a brand-new ecommerce store, aiming for a conversion rate between 1% and 2% is a solid, realistic starting goal. It’s easy to get discouraged when you see industry-wide averages, but remember, new businesses are still busy building trust, brand recognition, and a customer base. Don't compare your first few months to a household name.
Instead, your main job is to gather data and make small, steady improvements. Your initial rate is just a baseline. Seeing a 1.4% conversion rate in the early days is perfectly healthy and gives you a fantastic foundation to build on.
In the beginning, the goal isn't to hit some magic number. It's to establish a benchmark, understand how your first customers behave, and find the low-hanging fruit—those quick fixes that can start moving the needle in the right direction.
How Do Different Traffic Sources Affect Conversion Rates?
Not all website visitors are created equal. Where they come from has a massive impact on how likely they are to buy something, and understanding this is key to analysing your performance properly.
- Email Marketing: Traffic from your email list often converts the best. These are warm leads who already know you and (hopefully) trust your brand. They’re primed to buy.
- Organic Search (SEO): Visitors who find you by searching for something specific (e.g., "buy waterproof hiking boots size 10") usually have strong purchase intent. They know what they want, and you have it. These visitors convert well.
- Paid Social Media Ads: Traffic from platforms like Facebook or Instagram can have a lower conversion rate. Users here are often in a discovery mindset—more "window shopping" than actively looking to buy.
- Referral Traffic: Visitors who click through from a trusted blog or an influencer they follow often have high conversion rates. They arrive with a built-in level of trust, which is a huge advantage.
This variation is exactly why looking at a single, overall average ecommerce conversion rate doesn’t tell you the whole story. You need to segment your data by channel to see what’s really driving sales.
Should I Focus on Increasing Traffic or My Conversion Rate?
This is the classic ecommerce dilemma. While it’s tempting to pour more money into ads to get more eyeballs on your site, it’s almost always more cost-effective to first focus on improving your conversion rate.
Think of your website as a bucket. If that bucket has holes in it—like a poor user experience, confusing navigation, or a clunky checkout—pouring more water (traffic) into it won’t help. You'll just waste money as potential customers leak out.
First, fix the holes. Optimise your site to convert the traffic you already have. Once your conversion rate is healthy, every new dollar you spend on acquiring traffic will deliver a much higher return, creating a powerful engine for sustainable growth.
Ready to stop guessing and start growing? Click Click Bang Bang specialises in data-driven PPC and AI-first SEO campaigns that plug the leaks in your sales funnel and boost your conversion rates. Let us help you turn more visitors into loyal customers. Find out how we can help at https://clickclickbangbang.com.au.
Read NeXt
Or Read Our Latest
Click. CLick. Subscribe.
Get our best PPC insights, industry updates, and power moves delivered straight to your inbox. No fluff, just high-caliber strategies that actually work.
Don’t Leave Just Yet
Try Us For 30-Days,
Risk Free!!
We guarantee that you’ll love our work within the first 30 days, if not you’ll get your money back.
What have you got to lose?