Website Conversion Tracking: Boost Your Results Today
Last Updated

Why Your Website Conversion Tracking Isn't Working
So, you’ve got some form of analytics set up. You can see traffic coming to your site, people are clicking around, and maybe sales are even ticking up. But do you really know what’s driving those results? For many businesses, the answer is a surprising "no." They're often relying on incomplete or misleading data, which feels a bit like trying to navigate a new city with a blurry, outdated map.
Effective website conversion tracking is about moving beyond surface-level metrics, like page views or session duration, and understanding the actions that genuinely predict business growth. This is where many tracking setups fall short. They might track the final sale but miss all the crucial micro-moments leading up to it.
Think about the subtle signals: a user watching a demo video, downloading a pricing guide, or adding an item to their cart even if they don’t check out right away. These are the breadcrumbs that reveal a customer's journey and intent. Ignoring them means you’re missing valuable opportunities to optimise your marketing. For example, you might be pouring money into a campaign that generates thousands of clicks but very few high-quality leads. A common pitfall is misinterpreting the source of your best traffic, a problem you can start to address by understanding how to use negative keywords in Google Ads to filter out irrelevant clicks.
Shifting Focus from Vanity Metrics to Actionable Insights
One of the biggest mistakes we see is a focus on vanity metrics. High traffic numbers look great in a report, but they don't pay the bills. True success lies in identifying the patterns that indicate a visitor is moving closer to making a purchase. In Australia, the average eCommerce conversion rate sits at a modest 1.78%, a figure that highlights just how few visitors complete a purchase on their first visit. This makes tracking the entire customer journey, not just the final click, absolutely essential for growth. For more details on these figures, you can explore the latest Australian marketing statistics.
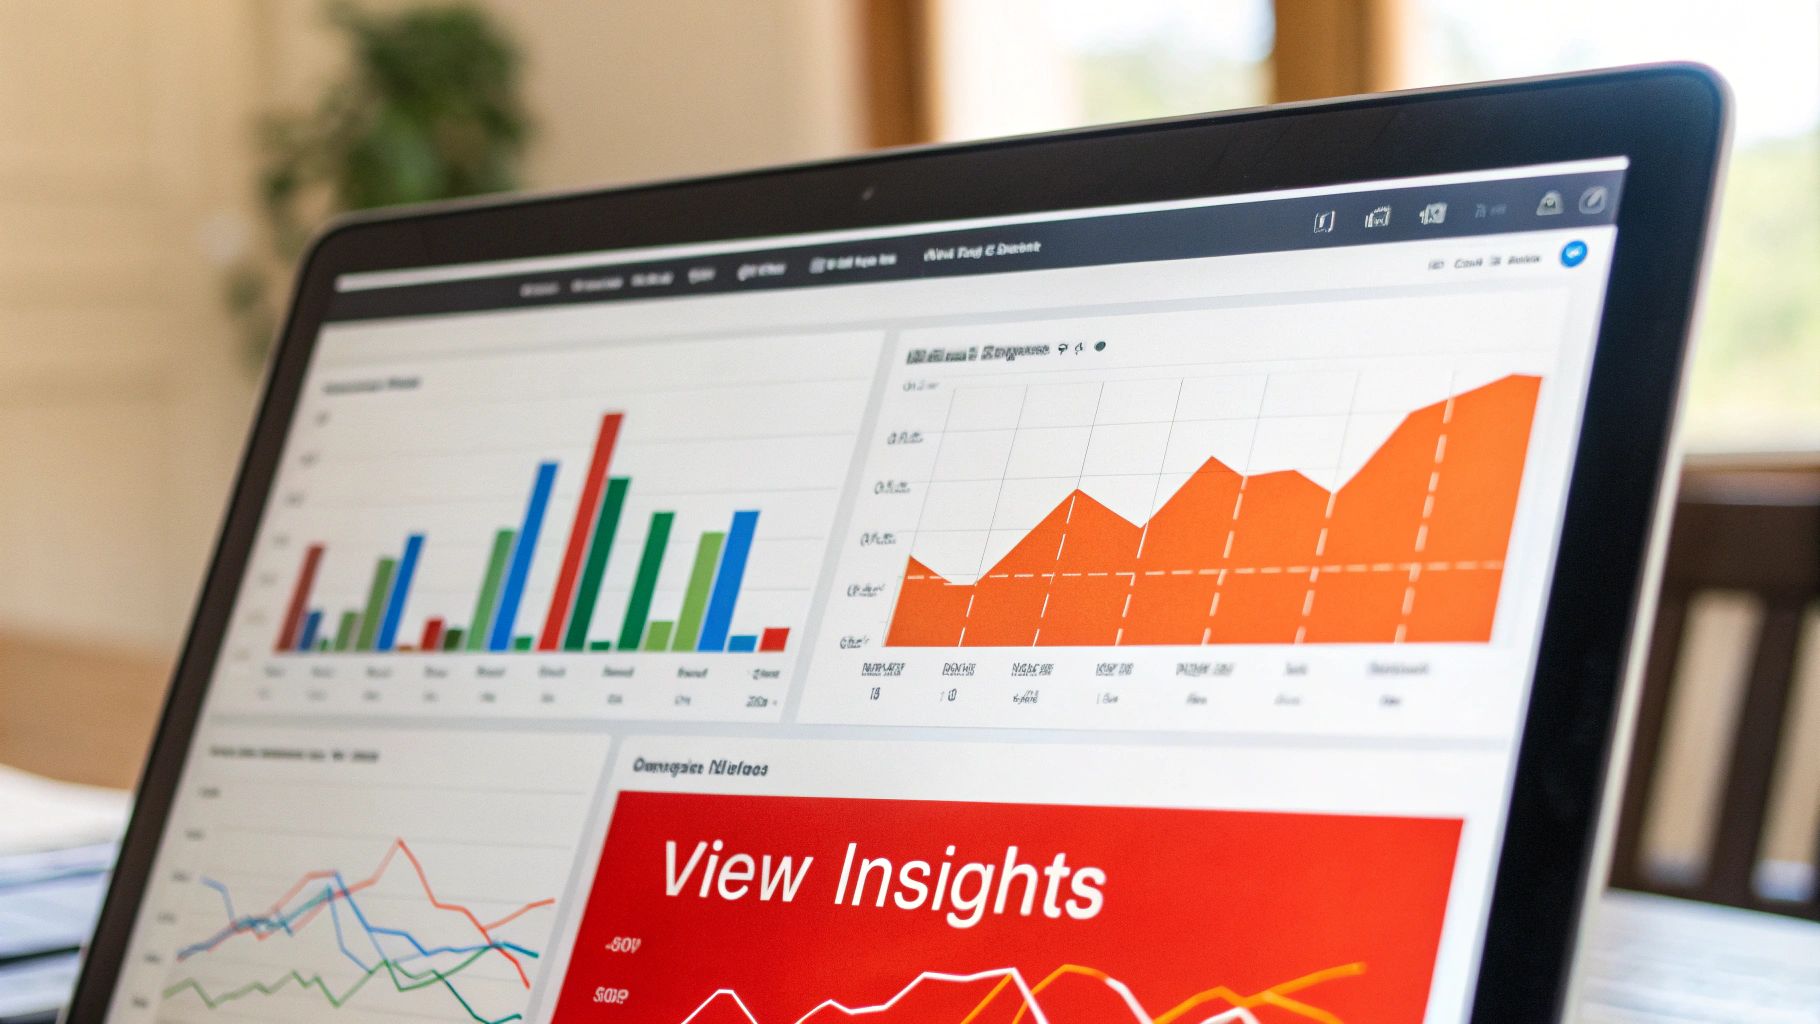
Here’s a look at a typical Google Analytics dashboard, which can be overwhelming if you don't know what to focus on.
While it shows traffic sources, the real value is in connecting these sources to specific conversion events that you’ve defined based on your business goals. Realising that your blog content drives more qualified leads than your direct ad campaigns, for instance, is an insight that can completely reshape your budget allocation and content strategy. This is when your tracking evolves from a simple reporting tool into a powerful decision-making engine.
Setting Up Google Analytics That Actually Tells You Something Useful
Moving past surface-level metrics like page views and sessions means getting your hands dirty inside Google Analytics. A standard, out-of-the-box setup is a good start, but it won’t show you what’s actually driving your business forward. A properly configured GA account is the difference between a cluttered data warehouse and a powerful decision-making engine. The real goal is to go beyond just installing the platform and start defining the specific user actions that signal genuine interest and lead to sales.
This process begins by creating a new GA4 property, which is Google's latest standard for web analytics.
The initial setup screen guides you through creating your account and a data stream, which is the pipeline that funnels information from your website into GA. The real work starts after this, when you need to define what a "conversion" actually means for your unique business goals.
Defining Meaningful Conversion Events
Simply tracking a final purchase isn't enough to give you the full picture. You need to identify and configure events for all the key touchpoints in your customer’s journey. This approach gives you a much richer understanding of user behaviour. Think about what actions a visitor takes before they are ready to buy.
For most businesses, useful conversion events to track in GA4 often include:
- Lead form submissions: A direct indicator of high intent.
- Key page views: Actions like visiting a pricing, demo, or "contact us" page.
- Video engagement: Tracking when users watch more than 75% of a product demo or key video.
- File downloads: For valuable resources like whitepapers, case studies, or spec sheets.
To help you decide which events are right for your business, here's a quick comparison of the different conversion types available in GA4.
| Conversion Type | Best For | Setup Difficulty | Data Quality |
|---|---|---|---|
| Automatically Collected Events | Basic engagement metrics like page views and sessions. | Easiest (No setup needed) | Good for top-level insights but lacks business context. |
| Enhanced Measurement Events | Tracking standard user interactions like scrolls, outbound clicks, and file downloads. | Easy (Toggle on/off in settings) | Adds valuable behavioural data with minimal effort. |
| Recommended Events | Tracking industry-specific actions, e.g., add_to_cart for e-commerce. |
Medium (Requires some code or GTM setup) | Provides standardised data that GA4 understands well. |
| Custom Events | Tracking unique business actions not covered by other types, e.g., "demo_request_form_submit". | Hardest (Requires custom code or advanced GTM) | Highest value, as it's tailored to your specific goals. |
As you can see, the most valuable data often requires the most custom setup. While automatically collected events are useful, custom events are where you get the specific insights that drive strategic decisions.
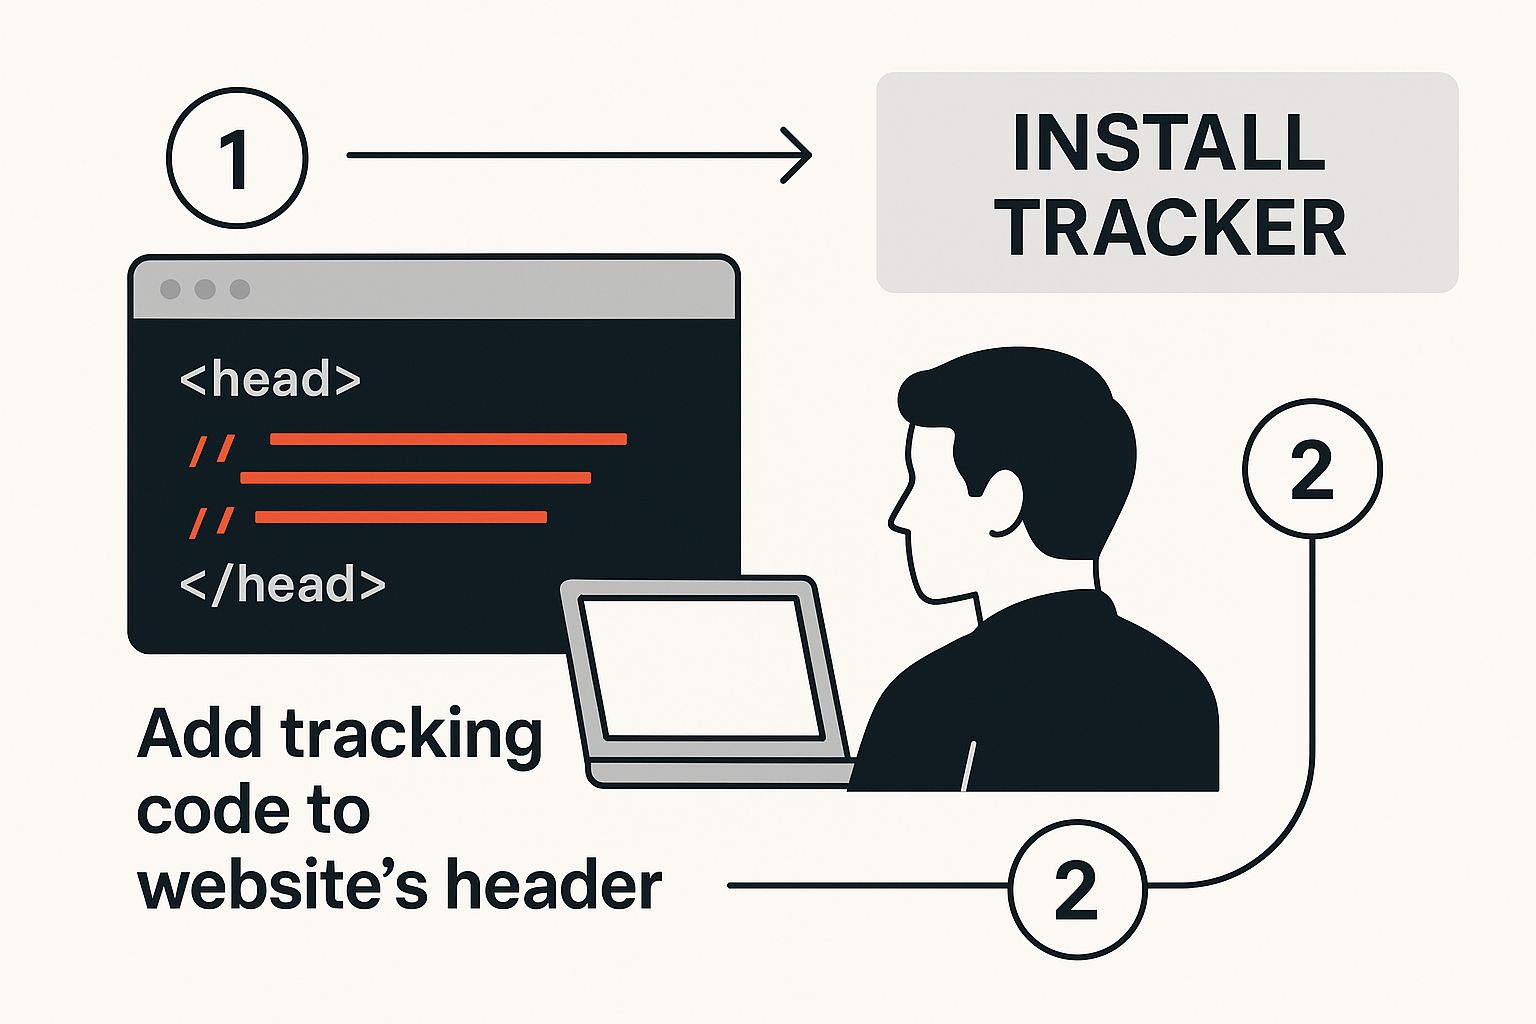
Once you’ve defined what to track, the next step is implementation. This visual shows a developer adding the necessary tracking code to a website's header, a fundamental step in enabling website conversion tracking.
This code snippet is what allows Google Analytics to listen for the specific events you’ve configured, turning user actions into measurable data points. By implementing these tailored events, you create a far more accurate picture of engagement, which helps you optimise your content and user experience based on what truly works.
The rising importance of this detailed tracking is reflected in market trends. In fact, the Australian web analytics market is projected to expand significantly, with a forecasted growth rate of 14.50% annually from 2025 to 2034. This surge is fuelled by the increasing need for businesses to use data for personalised customer experiences. You can discover more about this market growth. Adopting a data-centric approach ensures your marketing efforts are based on solid evidence, not just guesswork.
Google Ads Tracking That Reveals Your True ROI
While Google Analytics gives you the bigger picture of user behaviour, your Google Ads spend demands a much sharper focus. To get a real sense of your return on investment, you need to connect ad clicks directly to meaningful business outcomes. This is where dedicated website conversion tracking inside the Google Ads platform becomes essential. It’s the only way to know for sure which campaigns, ad groups, and keywords are actually making you money, instead of just costing you money.
The whole process kicks off by defining your conversion actions. These are the specific customer actions you value most. For an e-commerce store, the ultimate conversion is a completed purchase. For a B2B company, it might be a lead form submission or a high-value phone call. Without defining these, you're essentially flying blind and optimising for clicks instead of profits. A well-organised setup will separate your primary conversion goals, like sales, from micro-conversions such as newsletter sign-ups.
Aligning Tracking with Your Sales Cycle
A common mistake I see is applying a one-size-fits-all approach to tracking. An e-commerce business with a short, transactional sales cycle needs a completely different setup from a B2B service provider where a lead might take weeks or even months to close. This is where you need to get into the details and configure settings like your conversion window (how long after a click a conversion can be recorded) and attribution model. Opting for a data-driven attribution model, for example, gives credit to multiple ad touchpoints along the customer journey, painting a much more accurate picture of what truly influences a sale.
To get a clearer idea, have a look at the Google Ads conversion setup interface. This is your command centre for telling Google what a successful outcome looks like for your business.
From here, you can track everything from website actions to offline sales imported from a CRM. For businesses with longer sales funnels, importing offline conversions is a game-changer. It directly connects your ad spend to the final revenue figure, even if the deal closes a month later over the phone. For more details on this, check out our in-depth guide on Google Ads conversion tracking.
Understanding Australian benchmarks can also provide valuable context for your own performance. To help with that, the table below outlines some typical performance metrics for Google Ads campaigns in the Australian market.
| Google Ads Campaign Performance by Type |
|---|
| Benchmark conversion rates and performance metrics for different Google Ads campaign types in the Australian market |
| Campaign Type | Average Conversion Rate | Monthly Conversions | Best Use Cases |
|---|---|---|---|
| Search Campaigns | 4.5% | 150 | Capturing high-intent users actively searching for your products or services. Ideal for lead generation and direct sales. |
| Display Campaigns | 2.1% | 80 | Building brand awareness and reaching broad audiences. Best for top-of-funnel marketing and retargeting. |
| Shopping Campaigns | 3.5% | 120 | Driving e-commerce sales with product-focused ads. Essential for online retailers with a physical product catalogue. |
| Performance Max | 4.0% | 140 | Accessing all of Google's inventory from a single campaign. Good for goal-based advertisers with clear conversion actions. |
As the data shows, Search campaigns often deliver higher conversion rates and volumes in Australia. Local data suggests an average Google Ads conversion rate of around 4.5%, with Search campaigns often outperforming Display. Search campaigns can generate about 150 conversions monthly on average, a significant figure compared to the 80 typical for Display campaigns. You can read more about these Australian Google Ads insights to see how your own results stack up. By fine-tuning your tracking, you can ensure your ad budget is working as hard as possible to achieve your most important business goals.
Facebook And Instagram Conversion Tracking That Survives Privacy Updates
Tracking conversions on Facebook and Instagram used to be a relatively simple affair. However, recent privacy changes, particularly Apple’s iOS updates, have thrown a spanner in the works. Many businesses are still relying on outdated methods, which creates significant gaps in their data and leads to missed opportunities for optimisation. If your Meta ad performance seems to be on the decline, the problem might not be your ads, but your website conversion tracking setup.
To get a reliable picture of your campaign results today, you need to use two tools in tandem: the Meta Pixel and the Conversions API (CAPI). The Pixel is a client-side tool, meaning it tracks user actions directly within their browser. The catch is that it’s vulnerable to ad blockers and browser privacy settings. This is where CAPI becomes so important.
Why You Need Server-Side Tracking Now
The Conversions API is a server-side tool. It sends conversion data directly from your website's server to Meta's servers. This creates a much more stable and reliable connection that isn’t affected by a user’s browser settings. Think of it as having a direct, private phone line to Meta instead of relying on the public postal service, which can be easily disrupted. This dual setup ensures you capture a more complete dataset, giving you a truer sense of your campaign’s effectiveness.
Implementing both tools is now standard practice for experienced media buyers. Your first port of call for checking your setup’s health is the Meta Events Manager.
This dashboard shows you which events are firing from the browser (Pixel) versus the server (CAPI) and helps you diagnose any data-matching issues. When it’s configured properly, you can see how many users who interacted with your social ads actually converted, even if they switched devices or were impacted by privacy restrictions.
To get the most out of this, you’ll need to configure Aggregated Event Measurement. This system lets you prioritise up to eight standard or custom conversion events for optimisation, such as Purchase, Lead, or Add to Cart. For an e-commerce brand, placing Purchase as the highest-priority event is crucial. For a service-based business, a custom conversion like Booked Consultation might be your top priority. This ensures Meta’s algorithm optimises for the actions that generate real business value, not just vanity metrics. This robust tracking is the key to building powerful lookalike audiences based on your highest-value customers, fuelling future growth.
LinkedIn Ads Conversion Tracking For Complex B2B Sales Cycles
Tracking conversions on LinkedIn demands a different approach, particularly for B2B businesses where the journey from an ad click to a signed deal can take months. Unlike the fast transactions you see in e-commerce, B2B sales cycles are complex, involving multiple touchpoints and a whole committee of decision-makers. Because of this, effective website conversion tracking on LinkedIn isn't just about counting the final lead form submission; it's about understanding the entire customer journey.
The core of LinkedIn tracking is the LinkedIn Insight Tag, a snippet of code you place on your website. This tag is much more than a simple lead counter. It lets you monitor a sequence of valuable interactions that indicate genuine buying intent. For example, a prospect might first download a whitepaper, attend a webinar a few weeks later, and finally request a demo. Each of these is a meaningful micro-conversion that you should be tracking to figure out which campaigns are nurturing high-value accounts.
Measuring Progressive Engagement and Influence
When you're dealing with a long and complex sale, you have to think beyond last-click attribution. A smarter strategy involves setting up multiple conversion events that align with your sales funnel. This might look something like this:
- Top-of-funnel: Gated content downloads (e.g., ebooks, industry reports).
- Mid-funnel: Webinar registrations or views of a demo video.
- Bottom-of-funnel: "Contact Us" form submissions or quote requests.
By tracking these progressive steps, you can begin to see which LinkedIn campaigns are successfully moving prospects through your sales pipeline. This is all managed within the LinkedIn Campaign Manager, where you define and monitor these conversion actions.
This interface is your command centre for defining what a valuable interaction is and tying it back to your ad spend. For most B2B marketers, the ultimate goal is to integrate this data with their CRM. This connection allows you to link LinkedIn ad interactions directly to closed-won deals, measuring the platform's true revenue influence instead of just the volume of leads.
This full-funnel view is what separates good B2B advertising from great B2B advertising. It gives you the power to justify your ad spend with concrete revenue figures, proving the long-term ROI of your marketing efforts.
Testing And Fixing Your Conversion Tracking Before It Breaks
Setting up your conversion tracking is a huge win, but the job isn’t finished once the code is live. A "set it and forget it" approach is a recipe for disaster. Tracking can break from website updates, plugin conflicts, or changes in platform requirements, leading to corrupted data that quietly sabotages your optimisation efforts. For anyone serious about accurate website conversion tracking, proactive testing and regular maintenance are non-negotiable.
You don’t need to be a developer to start diagnosing issues. Several user-friendly tools are available to help you check if your tags are firing correctly. For Google-based tracking (Analytics and Ads), the Google Tag Assistant is your best friend. For Meta ads, the Facebook Pixel Helper Chrome extension provides similar insights. These tools show you in real-time which tags are active on a page and whether they're passing data correctly.
Spotting Problems Before They Snowball
Let's walk through a common scenario. Imagine you've launched a new landing page and want to ensure your Google Ads conversion tag is working. By using the Google Tag Assistant, you can simulate the user journey yourself. The tool will give you a live report of every tag that fires (or fails to fire) as you navigate the site and complete a test conversion.
Here is an example of what the Google Tag Assistant interface looks like when you connect it to your website for debugging.
The real-time feedback on tag status is the most important part of this view, showing you exactly which events were triggered successfully and which ran into errors. This immediate validation is incredibly valuable.
Running these simple checks can help you catch common but costly errors before they skew your data for weeks. Some of the most frequent issues we see include:
- Duplicate Conversions: This often happens when a tag is accidentally installed twice, causing every conversion to be counted multiple times. This inflates your performance metrics and can lead you to over-invest in underperforming campaigns. A quick check with Tag Assistant would immediately flag two identical conversion tags firing on your confirmation page.
- Missing Cross-Domain Tracking: If your customer journey spans multiple domains (e.g., from your main website to a third-party booking portal), you need to configure cross-domain tracking. Without it, the user session breaks, and the conversion is often misattributed to "Direct" traffic instead of the original ad click, hiding your true ROI.
- Impact of Cookie Consent Banners: Modern cookie consent tools can block tracking tags from firing until a user gives explicit permission. It's vital to test what happens when a user accepts, rejects, or ignores your cookie banner. You might find that your setup prevents any data collection for users who don't interact with the banner, creating a significant blind spot in your analytics.
Building a simple quality assurance checklist and running through it monthly, or after any significant website change, is a small time investment that pays huge dividends. It ensures the data you're using to make critical budget and strategy decisions is accurate and trustworthy.
Turning Conversion Data Into Marketing Decisions That Actually Work
Raw conversion data is just a list of numbers. It's what you do with those numbers that matters. Experienced marketers know how to dig into these figures, spot patterns, and find opportunities that others might miss. This is about moving from "what happened" to asking "why it happened" and, most importantly, "what should we do next?" It's the process of transforming your analytics from a simple report card into a genuine growth engine for your business.
The real magic happens when you start segmenting your audience. For example, you might notice that while desktop users convert more often, it’s the mobile users who download your product guide that eventually become your highest-value customers. Armed with that insight, you can build specific campaigns to nurture those mobile users towards a bigger sale, rather than just optimising for the immediate, but lower-value, desktop sign-ups.
From Insights to Action
Uncovering these valuable patterns isn't about luck; it requires a structured way of looking at your data. Once you've pinpointed a high-performing audience segment or identified a leaky part of your funnel, the next move is to act on it. This is where you connect your data to real-world marketing activities.
Here are a few practical actions you could take:
- A/B Testing Based on Behaviour: If you see users are consistently dropping off on a particular form field, why not test a version of the page with that field simplified or removed entirely? Let the data guide your experiment.
- Optimising Ad Spend: Let's say your data shows that LinkedIn ads are influencing high-value B2B deals, even if they don't have many direct, last-click conversions. This gives you the confidence to allocate more budget there, a common scenario for businesses with longer sales cycles. For more ideas on refining your paid search game, you can explore some established Google Ads best practices that perfectly complement these data-driven insights.
- Content Strategy Refinement: By analysing which blog posts or guides are most frequently part of a converting user’s journey, you can double down on creating content that truly resonates with your most valuable audience.
By setting up a regular rhythm of analysis and action, you create a powerful feedback loop that continuously improves your marketing performance. This proactive approach is what separates businesses that just collect data from those that use it to systematically grow.
Feeling a bit overwhelmed by the technical side of tracking and analysis? The team at Click Click Bang Bang specialises in building precision-driven PPC campaigns powered by robust data. We can handle the technical setup and ongoing analysis, leaving you to focus on making informed decisions that drive real results. Get in touch with us today for a risk-free trial.
Read NeXt
Or Read Our Latest
- SEO Cost Australia 2026: Your Guide to Pricing
- Offline Conversion Tracking: Guide for AU Businesses 2026
- How to Start Advertising on LinkedIn: 2026 Guide
- 7 B2B LinkedIn Ad Examples to Steal in 2026
- 7 Best Google Ads Managers in Australia for 2026
- Customer Data Platform Guide: Boost ROI & Meet AU Privacy
Click. CLick. Subscribe.
Get our best PPC insights, industry updates, and power moves delivered straight to your inbox. No fluff, just high-caliber strategies that actually work.
Don’t Leave Just Yet
Try Us For 30-Days,
Risk Free!!
We guarantee that you’ll love our work within the first 30 days, if not you’ll get your money back.
What have you got to lose?