

How to Calculate Sample Size for A/B Tests and Campaigns
Last Updated
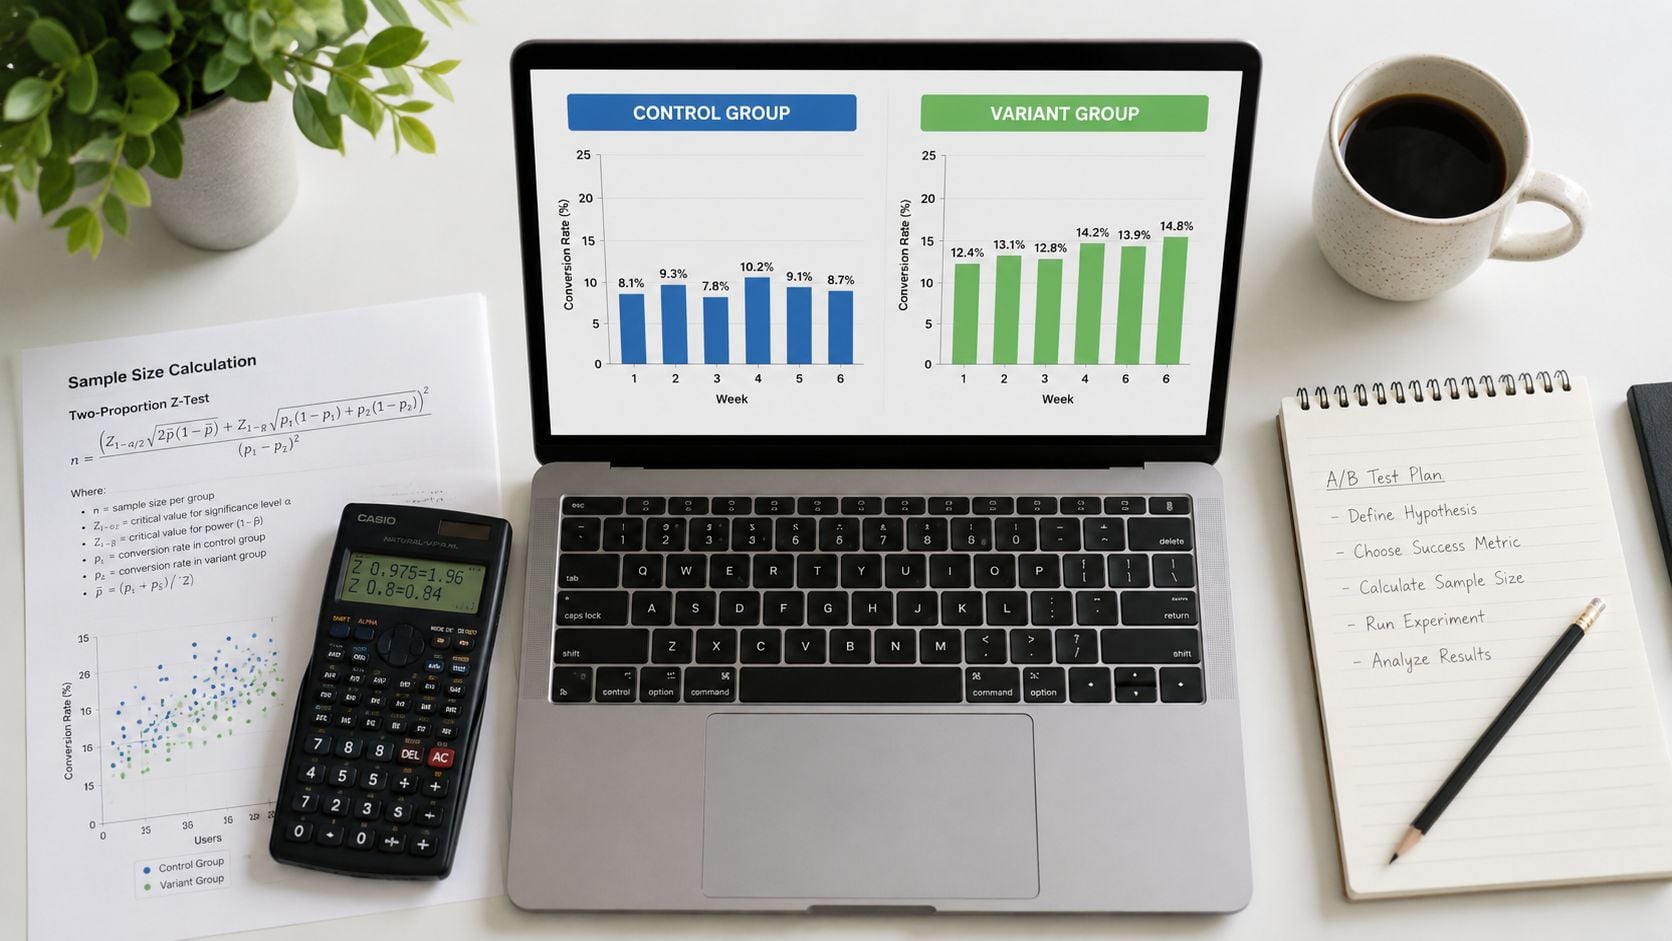
You've got a landing page test running, the new variant looks better in the first few days, and someone in the channel is already asking whether it's safe to roll it out. That's the moment sample size stops being a spreadsheet exercise and starts deciding whether you waste budget on a lucky spike or act on something real. If you've ever shipped a “winner” too early and watched the effect disappear, you already know why how to calculate sample size matters.
Why Sample Size Decisions Make or Break Your Tests
I've seen this happen in paid search more times than I can count. A team launches an A/B test on a lead form, the variant starts ahead, and by the time the junior marketer checks the dashboard on Friday afternoon, the lift looks obvious. The change goes live, the weekly report gets shared, and then the following month the conversion rate drifts right back to where it started.
That isn't bad luck. It's usually an underpowered test being treated like a finished result.
Sample size is the guardrail, not the garnish
Sample size is the number of usable observations you need before a result is worth trusting. In PPC and CRO, that usually means clicks, sessions, conversions, or completed forms. If the number is too low, the test can swing wildly from noise, seasonality, device mix, or one unusually good traffic pocket.
Practical rule: if you can't explain why your sample was large enough before you launched, you're probably guessing at the outcome as well.
That's why sample size sits underneath statistical significance and confidence. Significance tells you how likely it is that a difference is real rather than random. Confidence tells you how much trust you can place in the result. Sample size is what gives both of those ideas enough evidence to stand on.
In advertising, the cost of getting this wrong is concrete. Every click has a price, every day a test stays live has an opportunity cost, and every premature decision can push spend towards the wrong creative, audience, or landing page. A test that ends too early doesn't just create a messy dashboard, it can send budget into the wrong direction.
Guessing sample size is really guessing your result
Marketers often ask for a fast answer, but fast without a baseline is just a gamble with better formatting. If you decide the sample after looking at a few early conversions, you're letting the data tell you what you wanted to hear. That's not analysis, it's post-rationalisation.
The better habit is to decide the threshold first, then let the experiment run until it reaches that threshold. If your audience is small, your budget is tight, or your test design splits traffic unevenly, that decision becomes even more important. The fewer chances you get to rerun the test, the more disciplined the sample plan needs to be.
A reliable test isn't about collecting as much data as possible. It's about collecting enough data to make a call you can defend when the result is close, inconvenient, or slower than expected.
The Four Inputs You Need Before Any Calculation
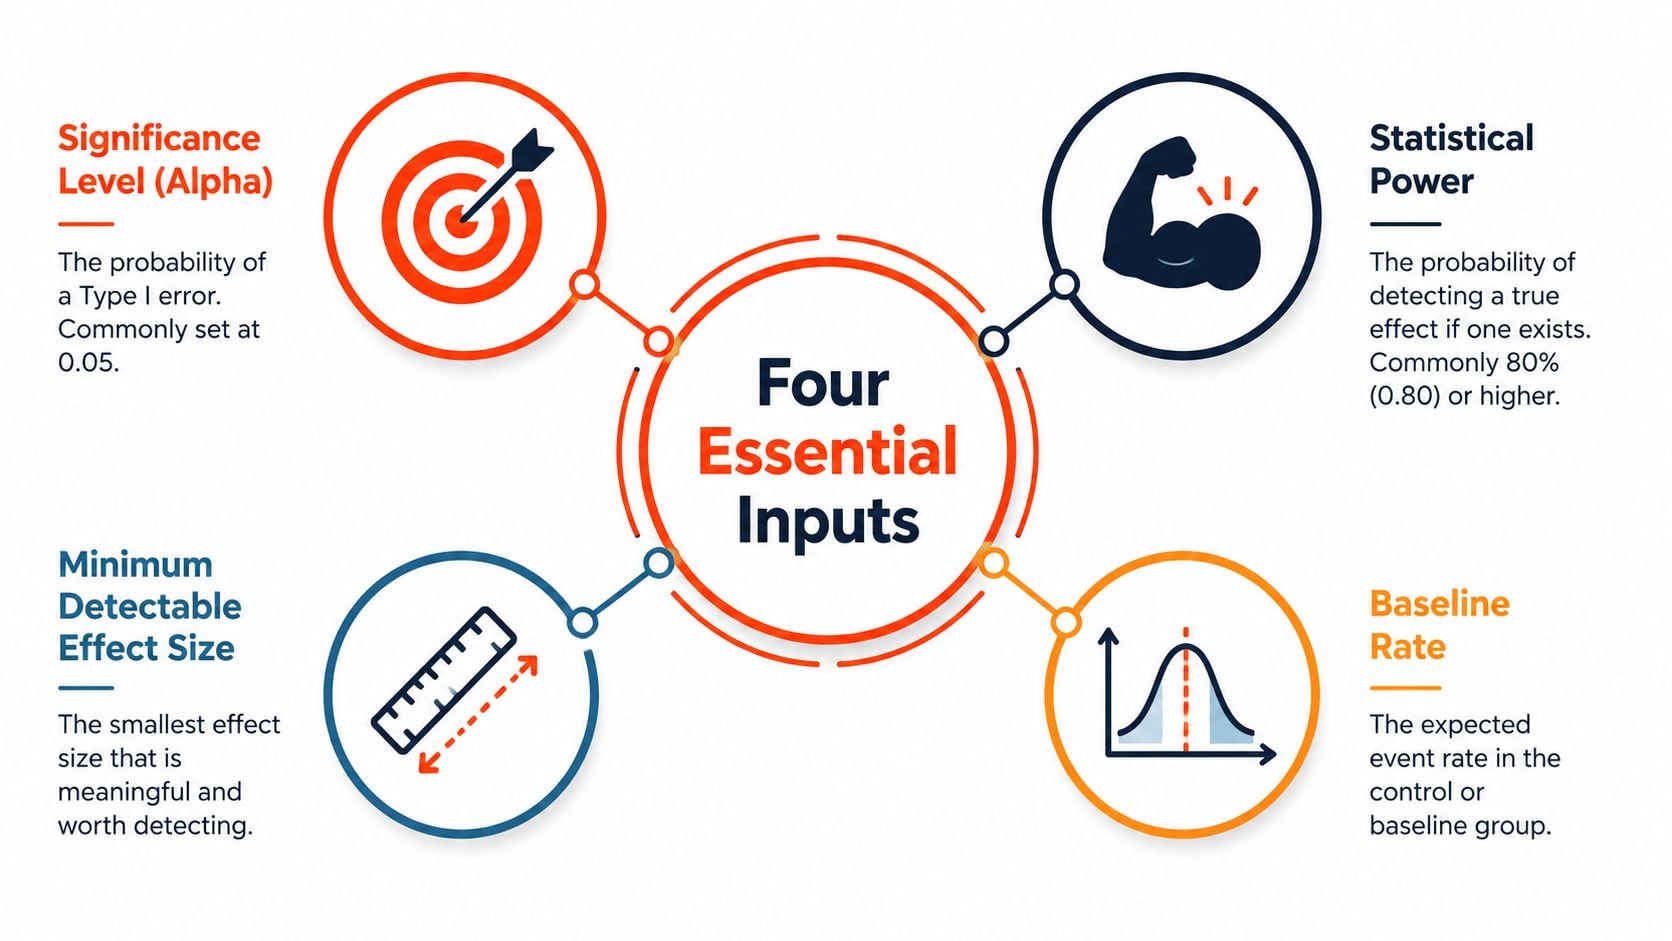
Before you open a calculator or start typing into Excel, you need four choices locked in. These are the levers that drive the answer, and changing even one of them can move the required sample a lot.
Significance level and power decide how strict you want to be
Significance level, usually called alpha, is the false alarm threshold. In practice, it's how willing you are to risk calling a winner when there isn't one. Teams often use 0.05 because it's a familiar default, but high-stakes pricing, budget, or audience decisions may justify being stricter.
Power is the chance of detecting a real effect if it exists. The common planning standard is 80% power, because it's a workable balance between confidence and feasibility. If your traffic is limited, you may not get there without waiting longer or accepting a smaller number of comparisons.
The practical trade-off is simple. Tighten alpha, raise power, and sample size grows. Loosen both, and you may reach a decision sooner, but you're also increasing the chance of being wrong.
Minimum detectable effect should come from the business, not your hopes
Minimum detectable effect, or MDE, is the smallest change worth caring about. That should come from campaign economics, not optimism. A tiny lift that can't move revenue, lead quality, or ROAS enough to matter is not a useful test target.
For PPC, this often means translating the lift into business value before you ever calculate sample size. If the change only becomes meaningful after it affects margin, lead value, or downstream conversion quality, set your MDE there. A lower MDE always needs more sample, so chasing tiny uplifts on thin traffic can make the test impractical before it starts.
If you're not sure how to anchor the business side, a conversion tracking setup gives you the baseline data you need to make the target more realistic. The practical part is straightforward, measure what happens on the site, not just what people intended to do, and use that as the starting point for your sample plan, like the approach outlined in this conversion tracking guide.
Baseline rate and variance change everything
Baseline rate is the current performance of the control. In conversion tests, it's your existing conversion rate. In revenue tests, it's the current average order value or revenue per user. Lower baselines usually mean you need more traffic to detect the same relative improvement.
That's where many marketers trip up. A test that looks manageable at one stage of the funnel can become massive once the conversion rate drops. If you don't have perfect historical data, use recent campaign performance from the same audience, device, and traffic source. Don't borrow a baseline from a totally different channel and pretend it's comparable.
If your baseline is fuzzy, your sample size will be fuzzy too.
For a simple visual summary, the infographic above is the quickest way to keep the four inputs straight while you're planning.
Formulas for Proportions and Means with Worked Examples
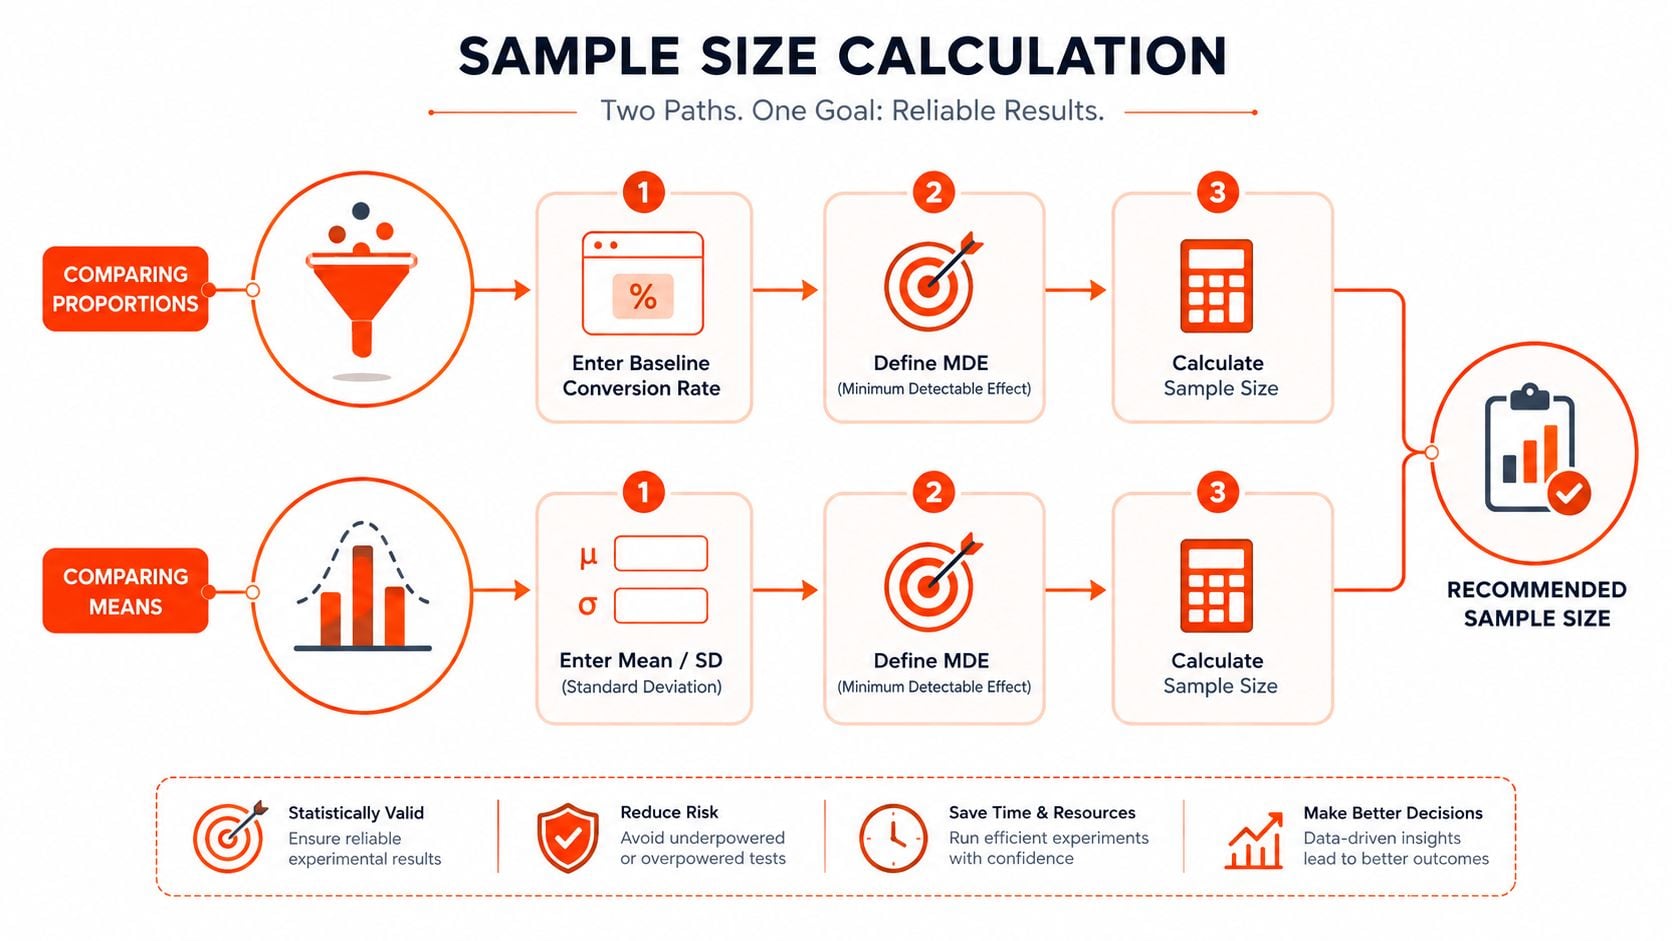
Most marketing tests fall into one of two buckets. You're either comparing proportions, like conversion rate or click-through rate, or comparing means, like average order value, revenue per user, or time on page. The formula changes depending on what you're measuring, and mixing them up is one of the easiest ways to get a meaningless answer.
Comparing proportions in a conversion test
For proportions, a common planning formula is built around the baseline rate, the effect you want to detect, the z value for alpha, and the z value for power. In plain English, you're asking how many sessions you need before you can tell whether one version converts better than another.
Take a Google Ads landing page that converts at 3.2% today. You want to detect a move to 3.8%, which is an absolute increase of 0.6 percentage points. That's the kind of gap a marketer can use, because it's tied to traffic volume, lead flow, and spend efficiency.
The calculation depends on the standard normal values for your chosen thresholds. For the common planning case of a two-sided 0.05 alpha and 80% power, the z values are the standard references used in most calculators. Rather than forcing hand math where a calculator is safer, the important part is understanding what goes into the result, not memorising the entire derivation.
If you want a quick way to sanity-check the effect-size side before running the full calculation, thecalcs effect size page is a useful reference for translating the size of a change into something you can compare across tests.
Comparing means in a revenue test
Means matter when the question isn't “did more people convert?” but “did the average outcome improve?” That might be average order value, revenue per visitor, or lead value. The logic is similar, but the spread of the data becomes much more important because noisy revenue data needs more observations.
Say your current average order value is stable enough that you can estimate the standard deviation from recent orders. You want to detect a $5 difference. If order values swing widely, the sample requirement rises fast because the test has to separate a real change from normal variation.
A practical way to think about it is this, proportions care most about how often an event happens, while means care about how messy the underlying values are. That's why mean-based testing often feels harder in e-commerce. Revenue is useful, but it's rarely tidy.
For teams that need to communicate this to non-technical stakeholders, the cleanest explanation is that the test has to be large enough to distinguish signal from ordinary purchasing noise. The formula is just the formal version of that idea.
Special Cases That Change Your Sample Size
Textbook sample size formulas assume a neat world where traffic splits evenly, audiences are unlimited, and the test only compares two tidy options. Real campaigns rarely cooperate. B2B audiences are finite, proven winners get protected traffic, and multivariate tests can turn a simple split into a lot of small groups that each need evidence.
Unequal splits and finite audiences
Unequal allocation is common when you don't want to give the variant half the traffic, especially if the control is already performing well. That choice usually means the variant needs more total traffic to reach the same power, because the comparison becomes less balanced. If you're running experiments on LinkedIn Ads to a tight account-based audience, this matters quickly.
Finite population correction comes into play when the audience itself is small enough that sampling starts to approach the full group. In those cases, the standard “infinite population” assumption can overstate the required sample. The same logic applies to internal lists, niche member databases, and narrow prospect pools where you can realistically reach most of the audience.
Multivariate tests multiply the burden
A multivariate test looks efficient because it lets you test more combinations at once. In practice, each extra combination divides traffic further, which makes it harder for any one variation to reach the needed sample. That's why multivariate testing works best when you already have enough traffic to support the extra complexity. If you don't, the design often looks smarter than it is.
Practical rule: if traffic is thin, a cleaner A/B test usually beats a clever multi-variant setup.
For teams considering that trade-off, the best starting point is a narrow hypothesis, not a sprawling matrix of combinations. The mechanics and risks are easier to manage when the test is designed around one meaningful decision. A useful primer on the practical side of this is this multivariate testing guide.
Sequential testing changes the timing, not the logic
Sequential testing lets you look early and stop when there's enough evidence. That sounds ideal when budgets are tight or audiences are small, but it only works if the stopping rules are defined before the test starts. Otherwise, peeking at results becomes just another way to overread noise.
The key trade-off is speed versus stability. Sequential designs can help when you need faster decisions, but they still need discipline. If the traffic pool is tiny, even sequential methods won't rescue a test that never had enough information to begin with.
| Scenario | Standard Sample Size | Adjusted Sample Size | Adjustment Factor |
|---|---|---|---|
| Unequal traffic split | Baseline requirement | Higher requirement | More traffic needed in the less-exposed group |
| Finite audience | Baseline requirement | Lower requirement | Correction for limited population |
| Multivariate test | Baseline per variant | Higher total requirement | Traffic divided across combinations |
| Sequential testing | Fixed end-point plan | Variable stopping point | Depends on early stopping rules |
Calculating Sample Size with Excel, R, and Python
Few will hand-calculate sample size twice. Once you understand the logic, the better move is to turn it into a repeatable workflow in the tools your team already uses. The goal here is speed with enough accuracy to make planning real, not a perfect statistics lesson disguised as a spreadsheet.
Excel works for quick proportion tests
Excel is often enough for straightforward conversion-rate planning. If you're testing proportions, you can build a calculator using standard normal functions and a few inputs for baseline rate, MDE, alpha, and power. That gives you something a strategist or account manager can use without waiting on a data scientist.
A simple setup is to put the inputs in cells, then use NORM.S.INV() to grab the z values for alpha and power. The exact spreadsheet layout depends on your team's preferences, but the principle stays the same. Keep the inputs visible, label the baseline clearly, and avoid hidden assumptions.
R is cleaner for exact power functions
R is the neatest option if someone on your team is comfortable with it. power.prop.test() handles proportion tests, and power.t.test() handles means. You pass in the baseline or expected effect, the target power, the significance level, and the function returns the sample size per group.
That matters because it removes a lot of the manual error that creeps in when people copy formulas into spreadsheets. It also makes it easier to rerun the calculation when the MDE changes mid-planning, which happens constantly in live campaigns.
Python suits teams that already automate analysis
Python is useful when sample size planning sits inside a broader reporting or experimentation workflow. The statsmodels package gives you tools for both proportions and means, so you can script the calculation once and reuse it across projects. That's handy when a team is comparing many ad sets, many landing pages, or several audience segments at once.
A simple Python script can read baseline rate, effect size, alpha, and power, then output the sample size per group. That's often enough for a practical internal calculator. If your team already uses notebooks for reporting, this keeps the planning step inside the same environment as the analysis step.
Common Mistakes and Quick Heuristics for Marketers
In our account reviews, the same planning mistakes keep appearing. They usually start before the test even runs. The test failed because the inputs were sloppy, and the team wanted a decision before the evidence was there.
The mistakes that keep costing teams money
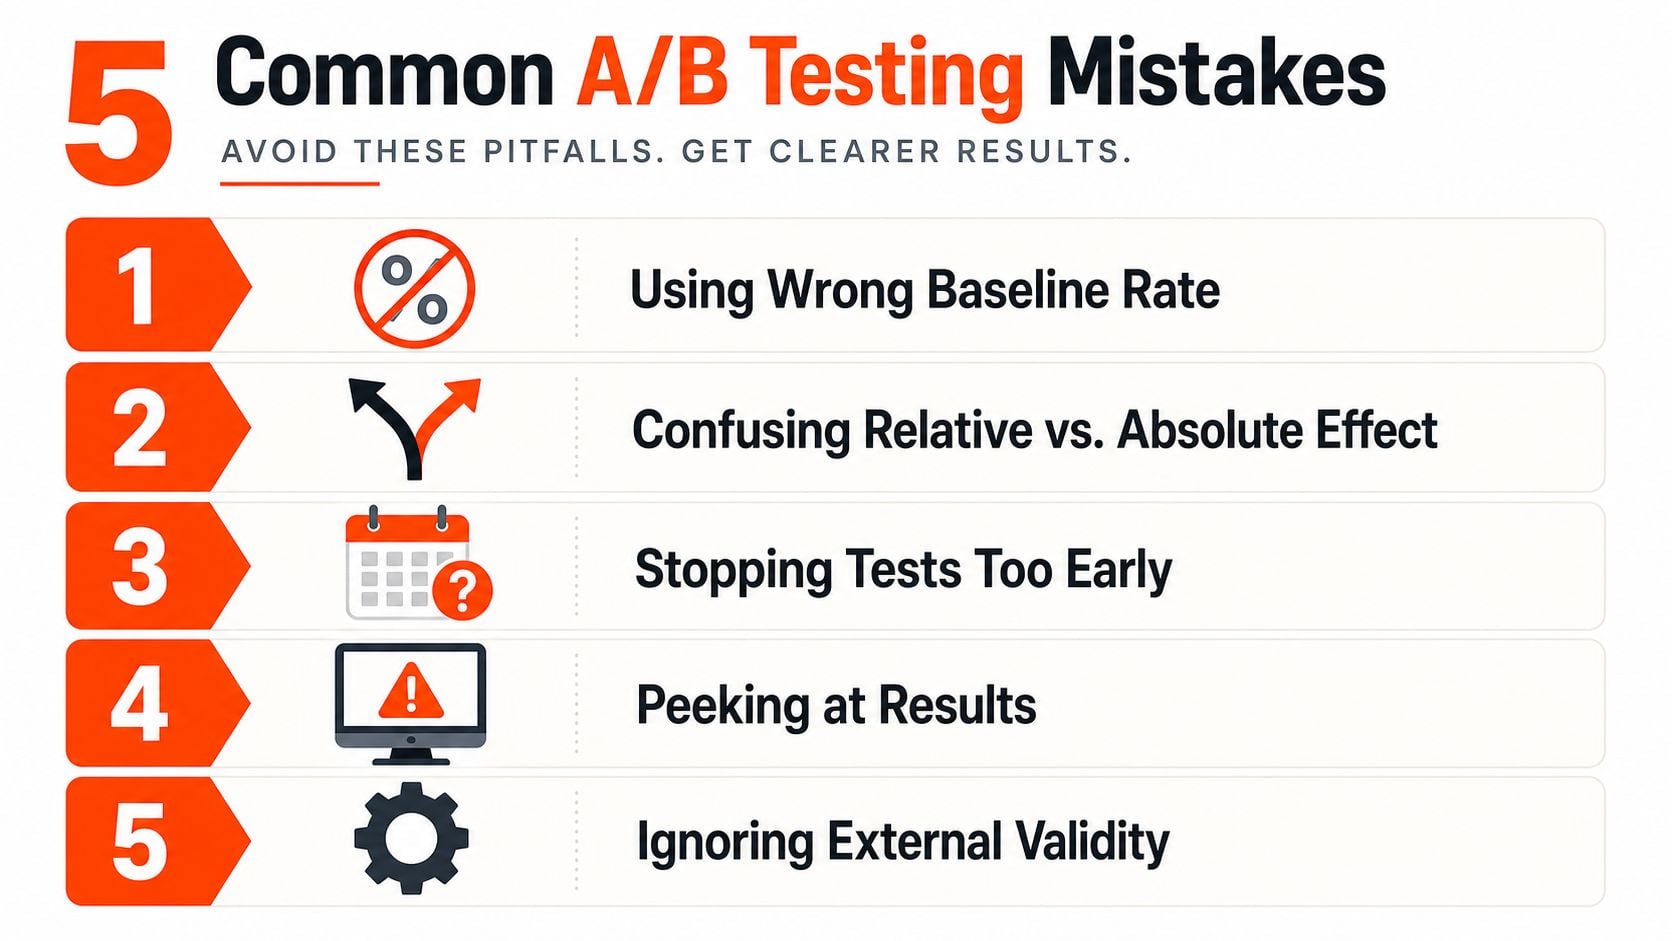
Using the wrong baseline rate usually shows up when someone copies a number from another channel or a different device mix. The fix is to use the baseline from the exact traffic segment you're testing.
Confusing relative and absolute lift happens when a marketer says a result is “up 20%” without checking whether that means 20% relative or 20 percentage points. Those are not the same thing, and the difference changes the required sample sharply.
Stopping tests too early looks like decisiveness, but it often means the test never had a fair chance to stabilise. The first clean-looking result is rarely the most reliable one.
Peeking at results creates a false sense of confidence because every refresh gives you a slightly different story. The more often the team checks, the more likely someone will act on a temporary spike.
Ignoring external validity is the quietest mistake. A result may be valid for one audience, season, or offer and still fail the moment it's rolled into a broader campaign mix.
For a broader optimisation context, the practical relationship between tests, messaging, and landing pages is covered in this conversion rate optimisation guide.
A quick test that can't survive contact with your broader audience isn't really a win, it's a local accident.
Quick heuristics when you're under time pressure
If you don't have time for a full calculation, use heuristics as a sanity check, not as a replacement. A test with low traffic, a tiny expected lift, or several variants is usually a bad candidate for hurry-up decision making.
A useful rule of thumb is to ask whether the decision would still matter if the result were directionally useful rather than definitive. If the answer is no, the test needs a more thorough plan. If the answer is yes, a smaller directional test may be enough to prioritise the next move.
When the traffic just isn't there, a Bayesian read, a qualitative check, or a simpler one-variable test is often better than forcing a weak A/B design. That's especially true when the campaign has a short buying cycle and the audience is narrow. The quickest way to waste budget is to pretend every question deserves the same level of proof.
Building a Testing Decision Framework
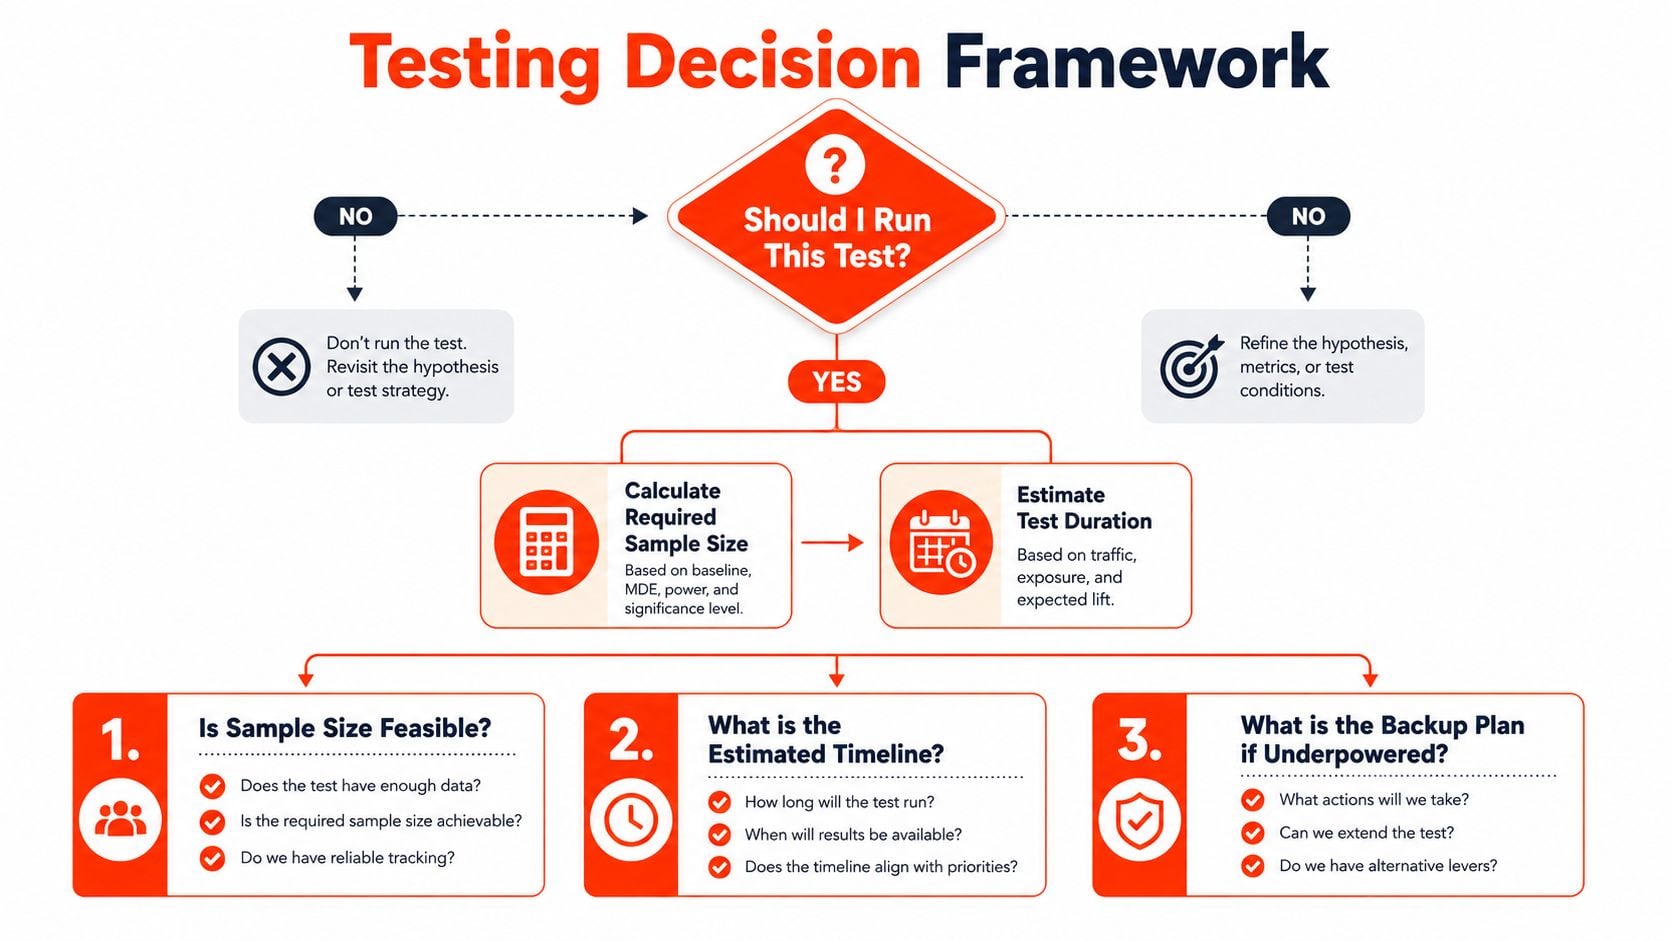
The question isn't just how to calculate sample size. It's whether the test is worth running at all, and if it is, whether the timeline fits the business decision you need to make. A clean framework saves more money than a clever formula because it stops weak tests before they consume spend.
Start with feasibility, not optimism
First ask whether the test can ever reach the required sample in a useful timeframe. If your daily traffic is too low, the answer may be no, even if the idea is good. That doesn't mean the hypothesis is wrong, it means the method isn't the right one for the current constraints.
Then estimate how long the test will take using your daily volume and the required sample per variant. That timeline matters because campaign conditions change. Offers expire, budgets shift, and seasonal effects can invalidate a test that drags on for too long.
Know your fallback before you launch
If the sample size is unreachable, the answer isn't to fake certainty. It's to change the method. That might mean narrowing the audience, reducing the number of variants, switching to sequential analysis, or using qualitative research to check whether the idea is worth a bigger experiment later.
For lead generation teams trying to map expected revenue back to spend, a practical planning layer like modeling ROAS for lead gen helps you decide whether a test has enough economic upside to justify the traffic it needs.
Decision point: if the sample requirement is bigger than the audience can deliver, the most honest answer is to redesign the experiment.
The best testing teams don't force every idea into the same frame. They decide whether a test is feasible, estimate the timeline, and keep a backup plan ready when the data won't support a clean answer.
If you want a team that treats experiment design, conversion tracking, and PPC performance as one system instead of three disconnected tasks, visit Click Click Bang Bang to see how we approach it. We build campaigns that are measured properly from day one, so your tests have a fair chance of producing answers you can trust.
Read NeXt
Or Read Our Latest
- How to Calculate Sample Size for A/B Tests and Campaigns
- How to Fix Google Merchant Center Errors Step by Step
- What Is Pagination and Why It Matters for AU Sites
- What Is Value Proposition? PPC & SEO Guide
- How to Choose a Google Ads Agency Australia
- Influencer Collaboration Playbook for E-Commerce & B2B
Click. CLick. Subscribe.
Get our best PPC insights, industry updates, and power moves delivered straight to your inbox. No fluff, just high-caliber strategies that actually work.
Don’t Leave Just Yet
Try Us For 30-Days,
Risk Free!!
We guarantee that you’ll love our work within the first 30 days, if not you’ll get your money back.
What have you got to lose?