Return on Ad Spend Calculator: Unlock Better ROAS Today
Last Updated

Making Sense of Your Return on Ad Spend Calculator
Return on ad spend (ROAS) is a vital metric for businesses investing in online advertising. It reveals how much revenue is generated for every dollar spent on ads. A higher ROAS generally signifies a more effective and profitable advertising strategy. ROAS calculators have become essential tools for marketers, particularly in dynamic markets like Australia. Digital ad revenue in Australia is projected to reach an estimated AU$17.1 billion (about US$11.2 billion) in 2024–25. This growth aligns with the overall expansion of the national advertising market, expected to reach US$20.74 billion in 2025, largely fueled by the increasing shift to online advertising. For more insights into these trends, check out the available statistics: Find more detailed statistics here.
Knowing how to effectively use a ROAS calculator is essential for maximizing returns in this competitive environment.
Understanding the ROAS Formula
Calculating ROAS is straightforward:
ROAS = (Revenue from Advertising / Cost of Advertising) * 100
Let's illustrate with an example. If you invest $100 in advertising and generate $400 in revenue, your ROAS is 400%. This translates to earning $4 for every $1 spent. While this basic formula provides a valuable overview of advertising performance, a deeper understanding of ROAS involves more than just the calculation.
What is a Good ROAS?
Defining a "good" ROAS depends on several factors, including your industry, profit margins, and overall business goals. While a higher ROAS is generally desirable, aiming for an unrealistic figure can be counterproductive. For example, a newly established business might prioritize growth and brand awareness over immediate profitability, initially accepting a lower ROAS.
To provide a general benchmark, let's consider average ROAS figures across different industries:
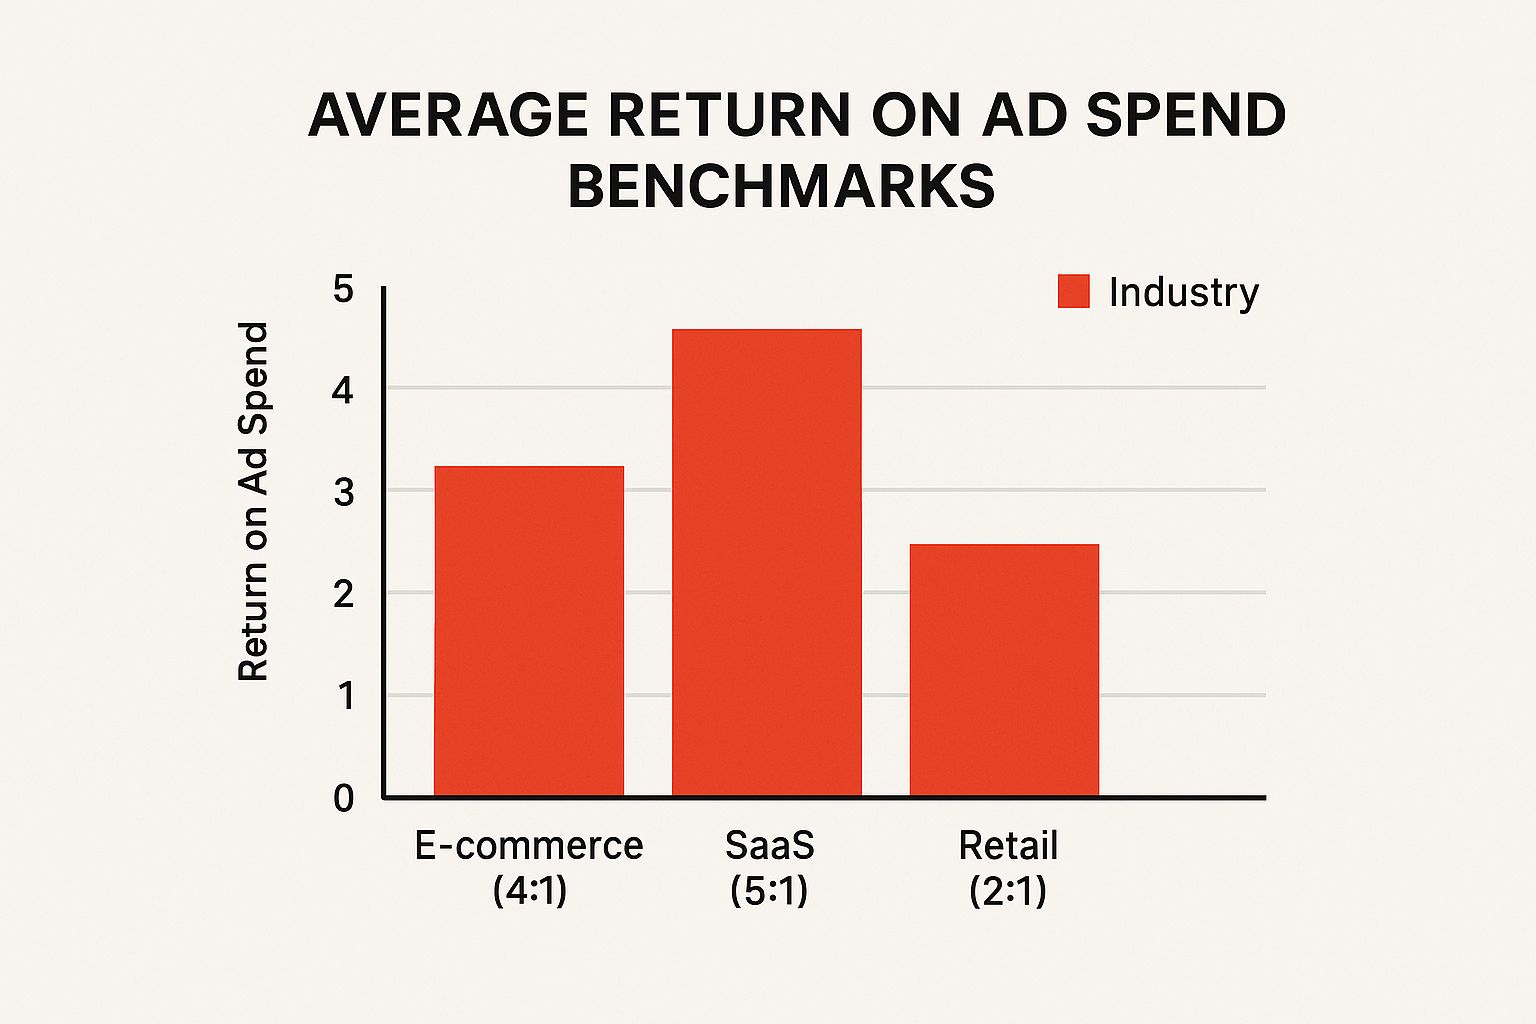
The infographic above visually represents typical ROAS benchmarks. E-commerce often sees a 4:1 ROAS, SaaS businesses aim for 5:1, while retail commonly operates around a 2:1 ratio.
These benchmarks offer a valuable starting point. However, it's crucial to consider your specific business context. This includes understanding your target audience, the competitive landscape, and unique market factors. A deeper understanding of these nuances allows for more informed interpretation of your ROAS data.
To further clarify these industry differences, let's examine a comparison table:
To illustrate these industry-specific benchmarks, let's look at a comparison table:
ROAS Benchmark Comparison by Industry
| Industry | Average ROAS | Good ROAS | Excellent ROAS |
|---|---|---|---|
| E-commerce | 4:1 | 5:1 | 6:1+ |
| SaaS | 5:1 | 8:1 | 10:1+ |
| Retail | 2:1 | 3:1 | 4:1+ |
This table showcases how ROAS expectations can vary widely. While a 2:1 ROAS might be acceptable in retail, it would be considered underperforming for a SaaS business. Remember, these are just averages; actual results can fluctuate based on specific campaigns and market conditions. Using these benchmarks as a guide, alongside a thorough understanding of your business and industry, will help you set realistic and achievable ROAS targets.
Features That Actually Matter in ROAS Calculators
Not all return on ad spend (ROAS) calculators are created equal. Choosing the right one can significantly impact your ability to optimize campaigns and boost your bottom line. This section explores the key features that distinguish basic ROAS calculators from those that deliver real, actionable insights for Australian businesses.
Essential Functionalities For Accurate ROAS
A robust ROAS calculator should go beyond the basic formula. Look for features that address real-world marketing complexities:
-
Multi-Channel Attribution: Accurately assess the contribution of various marketing channels, not just the last click. This is crucial for understanding the customer journey, especially if you are running campaigns across Google Ads, Facebook Ads, and other platforms.
-
Lifetime Value (LTV) Integration: Factor in the long-term value of customers acquired through advertising. A customer who makes repeat purchases over time contributes more revenue than a one-time buyer, and your ROAS calculator should reflect this.
-
Automated Data Syncing: Eliminate manual data entry and ensure accuracy by integrating your calculator with advertising platforms and analytics tools. This streamlines the process and provides a more comprehensive view of your ROAS.
For example, imagine a customer interacts with your Facebook ad, then later clicks on a Google Search ad before finally making a purchase. A multi-channel attribution feature will accurately distribute the credit among these touchpoints. You might be interested in: How to master Google Ads Keyword Research to further enhance your campaign effectiveness.
Handling Complex Scenarios
The best ROAS calculators handle the nuances of modern marketing, including:
-
Cross-Platform Campaigns: Effectively measure ROAS across different advertising platforms, providing a consolidated view of your overall performance. This avoids siloed data and allows for more strategic budget allocation.
-
Delayed Conversions: Account for conversions that happen days or even weeks after the initial ad interaction. This is especially important for high-value purchases where the decision-making process is longer.
-
Varying Attribution Windows: Adjust the timeframe for attributing conversions to specific ads, allowing for more flexible and accurate analysis.
Integration and Accessibility
In today's fast-paced marketing environment, these features are also essential:
-
Integration With Major Advertising Platforms: Seamlessly connect with platforms like Google Ads and Facebook Ads to automate data retrieval and ensure up-to-the-minute accuracy.
-
Mobile Accessibility: Access and utilize the calculator on any device, allowing you to monitor performance and make adjustments on the go.
-
Real-Time Updates: Get instant access to the latest ROAS data, enabling quick reactions to market changes and campaign performance fluctuations.
-
Collaborative Features: Share reports and insights with team members and stakeholders, fostering better communication and informed decision-making.
These features, when combined, empower you to move beyond simple calculations and use your ROAS calculator as a powerful tool for optimizing campaigns, improving profitability, and achieving sustainable growth in the Australian market.
Boosting ROAS in Australia's Unique Digital Market

The Australian digital advertising market presents unique opportunities for marketers looking to maximize their return on ad spend (ROAS). Understanding the local market dynamics, consumer preferences, and platform usage is essential for achieving strong ROAS performance. Tailoring strategies to the Australian context is key to unlocking success.
Understanding the Australian Digital Landscape
The Australian market is diverse. Consumer behavior differs across regions and demographics. For example, urban audiences might be more receptive to mobile advertising compared to rural consumers. This underscores the importance of regional targeting and audience segmentation in campaign planning. Cultural nuances also influence how Australians respond to advertising, meaning a successful campaign in one city might not resonate in another.
Creating ad creatives specifically designed for the Australian market is essential. Generic campaigns often fail to capture the attention of Australian consumers.
Leveraging Programmatic Advertising and Analytics
The growth of programmatic advertising and advanced analytics in Australia has made ROAS calculators vital. Automated ad buying and selling now represent over 85% of digital display ad spend globally. Industries like automotive and finance have heavily invested in digital static display ads, with spending reaching over AU$106 million (auto) and AU$240 million (finance) in recent years. Marketers in these sectors rely on ROAS tools for effective budget allocation. Explore this topic further.
This trend emphasizes the importance of data-driven decision-making in Australian advertising. Understanding and utilizing a return on ad spend calculator is crucial for success.
Optimizing ROAS Across Key Platforms
Australians have distinct platform preferences. While Google and Facebook remain dominant, platforms like TikTok have seen significant growth, particularly among younger demographics. This presents both challenges and opportunities. Adapting strategies to each platform's specific characteristics is vital.
This includes optimizing ad creatives, targeting parameters, and bidding strategies for each platform. Visual platforms like Instagram and TikTok require engaging video content, while search-based platforms like Google benefit from targeted keywords.
Practical Techniques for Improving ROAS in Australia
Several strategies can significantly improve ROAS in the Australian market:
-
Refined Audience Segmentation: Divide your audience into smaller groups based on demographics, interests, and behavior. This allows for more targeted messaging and better budget allocation.
-
Creative Optimization: Create ads that resonate with Australian consumers. Incorporating local slang, humor, and cultural references can improve engagement.
-
Seasonal Trends: Capitalize on seasonal trends and events. For example, target back-to-school shoppers with relevant promotions during the summer months.
-
Budget Allocation: Strategically distribute your budget across different platforms and campaigns based on performance and potential ROAS. Continuously monitor and adjust to maximize returns.
By understanding the Australian market and implementing practical ROAS optimization techniques, businesses can substantially improve their advertising performance. This leads to a higher return on ad spend, ultimately contributing to greater profitability and growth.
Mastering Video Campaign ROAS Calculations
Video advertising requires a nuanced approach to Return on Ad Spend (ROAS) calculation. Its unique engagement patterns and complex conversion pathways demand a deeper understanding than traditional advertising metrics. This section explores how to accurately measure the returns from your video campaigns across popular Australian platforms like YouTube, TikTok, and Facebook.
Accounting For View-Through Conversions and Engagement
Unlike traditional advertising, video campaigns often influence conversions without a direct click. View-through conversions, where a user sees your video ad and later converts without clicking, are a key factor in video's success. Engagement metrics, such as watch time, likes, and shares, also contribute to brand awareness and long-term customer value. Accurately assessing ROAS means considering these less direct interactions.
For example, imagine a viewer watches your YouTube ad about a new product. Later, they search for the product directly on your website and make a purchase. This conversion, even without a direct click on the ad, should be attributed to your video campaign.
This means video ROAS isn't solely about immediate sales. It's also about building brand recognition and moving potential customers through the sales funnel. This approach acknowledges the multifaceted role video plays in influencing customer behavior.
Setting Up Reliable Tracking for Video Campaigns
Accurate video ROAS measurement depends on strong tracking mechanisms. This involves implementing platform-specific tracking pixels and setting up conversion goals aligned with your campaign objectives. Using UTM parameters in your video ad URLs allows for granular tracking of traffic sources and overall campaign performance.
For instance, if your campaign goal is driving website traffic, your conversion tracking should focus on website visits originating from your video ads. This focused approach provides a more accurate measure of campaign effectiveness.
Video marketing in Australia is experiencing rapid growth. Short-form video ad spending is projected to reach AU$3.255 billion by 2028, a nearly 50% increase from the AU$2.182 billion spent in 2024. The overall Australian video marketing ad spend is predicted to grow at a 5.26% CAGR, reaching AU$6.37 billion by 2028. Discover more insights about video marketing statistics. This growth makes accurate ROAS calculation crucial for sustained success.
Calculating ROAS for Brand Awareness and Direct Response
Video campaigns often serve two purposes: building brand awareness and driving direct response. This requires a balanced approach to ROAS calculation. While direct response is measurable through traditional sales figures, brand awareness needs metrics like reach, impressions, and engagement to demonstrate its value.
A brand awareness campaign might not generate immediate sales. However, it could significantly increase website traffic and social media engagement. These indirect metrics should be factored into the overall ROAS calculation, even without a direct link to immediate revenue.
Factoring In Cost-Per-View and Completion Rates
Metrics like cost-per-view (CPV) and completion rates offer valuable insights. A low CPV combined with a high completion rate suggests efficient ad delivery and engaging content. However, it’s important to analyze these metrics alongside conversion data to gain a complete understanding.
This prevents relying on vanity metrics and keeps the focus on overall business outcomes. A comprehensive view of your video campaign performance provides the most accurate insights.
Video Platform ROAS Calculation Methods
To help you understand the different approaches across platforms, let's look at a breakdown of how each major video platform calculates ROAS. This table highlights the primary metrics, attribution windows, and general calculation methods used.
| Platform | Primary Metric | Attribution Window | Calculation Method |
|---|---|---|---|
| YouTube | View-through Conversions, Watch Time | 30/90 days | (Conversion Value + Estimated Brand Value) / Ad Spend |
| TikTok | Cost Per Acquisition (CPA), Click-through Conversions | 7/14 days | Conversion Value / Ad Spend |
| Conversions, View-through Conversions | 1/7/28 days | Conversion Value / Ad Spend |
This table offers a simplified overview. Actual ROAS calculations often involve more complex platform-specific factors and can vary based on individual campaign settings.
Advanced Multi-Channel ROAS Calculation Strategies

Modern marketing relies on a deep understanding of how customers interact with your brand across various platforms. This means your approach to calculating Return on Ad Spend (ROAS) needs to be more sophisticated than just plugging numbers into a basic formula. Let's explore some advanced strategies for measuring ROAS in a multi-channel world.
Attribution Modelling and Cross-Channel Measurement
Figuring out how much each touchpoint contributes to a conversion is vital. Attribution modelling helps with this by assigning credit to different marketing channels based on their influence. Simpler models, like last-click attribution, give all the credit to the final interaction. More complex models, such as linear or time-decay attribution, distribute credit across several touchpoints.
Think about a customer who first sees your ad on Facebook, then visits your website through a Google search, and finally buys something after clicking a retargeting ad. A multi-channel attribution model helps you understand the role of each channel in that final purchase.
This provides a much more complete understanding of your marketing performance. Knowing how each channel contributes allows you to optimize your budget and improve your overall ROAS.
Handling Data Discrepancies and Creating Unified Reports
Different platforms often report data in different ways. This can lead to inconsistencies when you're calculating ROAS. It’s important to have a plan for dealing with these discrepancies. You might need to standardize data formats, adjust attribution windows, or use third-party reporting tools to bring data from multiple sources into one place.
This creates a unified view of your marketing performance. A single, consistent report provides clearer insights and makes decision-making much more effective.
Advanced Techniques for Accurate ROAS Measurement
Basic ROAS calculations don't always tell the whole story. More advanced techniques can give you more accurate insights:
- Incrementality Testing: This involves A/B testing to see the real impact of your campaigns. By comparing results with and without advertising, you can isolate the effect of your ads on revenue.
- Holdout Groups: A holdout group is a control group that doesn’t see your ads. This helps you understand your baseline conversion rate and more accurately attribute conversions to your advertising.
- Statistical Methods: Using statistical analysis on your ROAS data can uncover hidden trends and improve your forecasting. This allows for more data-backed decisions about future campaign adjustments. Check out this helpful guide on How to Master Google Ads Best Practices.
These methods dig deeper than surface-level metrics and provide a much better understanding of your campaigns' impact. This depth of analysis is crucial for strategic decision-making and maximizing your ROI.
Real-World Scenarios and Advanced Methodologies
Imagine a customer interacting with your ad several times on different devices before finally converting. Basic ROAS calculations might oversimplify this journey. Advanced methodologies, however, can accurately give credit to each interaction.
This precision is essential for optimizing complex campaigns. By understanding the full customer journey, you can refine your targeting, messaging, and budget to achieve a better ROAS. This nuanced approach allows you to unlock the full potential of your multi-channel marketing strategy.
Avoiding Critical ROAS Calculator Mistakes
Even seasoned marketers can stumble when calculating their return on ad spend (ROAS). Miscalculations can lead to poor campaign choices and wasted budget. This section explores common pitfalls and how to steer clear of them.
Common ROAS Calculation Errors
Some frequent ROAS calculation mistakes include:
-
Incorrect Formula Application: Using the wrong formula or plugging in bad data will obviously skew your results. Always double-check your calculations and data sources.
-
Ignoring Organic Sales: Attributing all revenue to advertising when some sales would have happened organically inflates your perceived ROAS. Factor in organic sales for a true picture.
-
Overlooking Attribution: Failing to consider the entire customer journey and properly assigning credit to different touchpoints can lead to inaccurate ROAS measurements.
For example, if a customer interacts with multiple ads before buying, relying solely on a last-click attribution model might not reflect the impact of earlier interactions. This can lead to misinformed campaign decisions.
Correcting Conversion Tracking and Revenue Attribution Issues
Accurate conversion tracking is the bedrock of reliable ROAS. Make sure your tracking pixels are correctly implemented and that your conversion goals align with your business objectives. This is crucial for gathering precise data and making informed choices. For expert guidance, explore resources like the guide on How to Master Google Ads Conversion Tracking.
Revenue attribution also needs careful thought. If a customer interacts with both online and offline channels, attributing all revenue to online advertising creates a distorted view.
This highlights the importance of including offline conversions in ROAS calculations. Tracking phone calls or in-store visits generated by online campaigns contributes to a more holistic understanding.
Time Period Selection and Benchmark Comparisons
Choosing the right timeframe for your ROAS analysis is key. Comparing short-term ROAS to long-term averages can be deceptive. Likewise, comparing ROAS across different campaign types without considering their individual goals can also skew your interpretation.
For example, brand awareness campaigns may have a lower initial ROAS than direct response campaigns. This doesn’t necessarily mean they are less effective; their contribution to long-term brand building is valuable.
Data Quality Issues and Platform Discrepancies
Data quality is paramount for precise ROAS calculation. Ensure your data is clean, accurate, and consistent across platforms. Different ad platforms often have varied reporting methods. These differences can cause discrepancies, particularly when not using a dedicated ROAS calculator.
Comparing cross-platform results can be tricky. A consistent measurement methodology across all platforms significantly improves the reliability of your ROAS calculations.
Implementing Quality Control Measures
Regularly review your ROAS data for inconsistencies or warning signs. This might involve looking for sudden ROAS drops, unexpected conversion spikes, or significant discrepancies between platform reports. These issues can point to tracking errors, data problems, or other issues requiring attention.
Established quality control procedures, such as regular data audits, can significantly enhance the accuracy of your ROAS calculations. This enables data-driven decisions based on reliable data. Proactive issue resolution prevents faulty insights from negatively affecting your budget and campaign effectiveness.
Building Your ROAS Calculator Success Framework

A Return on Ad Spend (ROAS) calculator is more than just a tool for crunching numbers; it's a strategic asset. This section outlines how to build a framework for using your ROAS calculator effectively, turning it into a driver for business growth. This means establishing clear processes, training your team, and integrating ROAS insights into your overall business strategy.
Step-by-Step Implementation Plans
Implementing a ROAS-driven approach needs a structured plan. Here’s a basic framework:
-
Define Clear Objectives: What are you hoping to achieve with your advertising? Is it increased sales, generating more leads, or building greater brand awareness? Your objectives will determine your ROAS targets.
-
Set Realistic ROAS Goals: Begin with attainable targets based on your industry’s benchmarks and the specific details of your business. Don’t reach for unrealistic numbers initially.
-
Develop a Tracking System: Put a strong conversion tracking system in place across your advertising platforms. Accurate tracking is the foundation of meaningful ROAS calculations.
-
Regularly Monitor and Analyse: Establish a regular reporting schedule and stick to it. Analyzing your ROAS data regularly is crucial for spotting trends, finding problems, and adjusting your campaigns as needed.
For instance, if your objective is to increase sales by 20%, a good starting ROAS target might be a small improvement over your existing performance. As your campaigns progress and you gather more data, you can gradually raise your ROAS goals.
Establishing Regular Reporting and Actionable Insights
Consistent reporting is the key to informed decision-making. But reports are only valuable if they lead to action. Here’s how to ensure your reporting process delivers:
-
Set a Regular Reporting Cadence: Choose a reporting frequency – weekly or monthly – that works for your business. This usually strikes a good balance between detailed information and manageable reporting.
-
Focus on Key Metrics: Avoid getting lost in superficial metrics. Focus on the metrics that directly affect your ROAS and your business objectives.
-
Create Actionable Recommendations: Every report should offer clear, specific recommendations on how to improve ROAS based on the data analysis.
This approach turns your reports from static documents into active tools for continual improvement, ensuring your data informs your strategy and makes your advertising more responsive and effective.
Best Practices for Team Training and Stakeholder Communication
A successful ROAS-driven strategy needs buy-in from your team and stakeholders. Here’s how to make that happen:
-
Team Training: Make sure everyone involved knows how to use and understand ROAS data. Training should cover basic ROAS calculation, reporting, and the things that influence ROAS.
-
Stakeholder Communication: Regularly share ROAS performance and insights with stakeholders. Clear, concise communication keeps everyone in the loop and builds confidence in the strategy.
-
Integrate ROAS into Broader Business Decisions: ROAS isn't a metric that should stand alone. Integrate ROAS data into broader business decisions, including budget allocation and product development.
This helps create a data-driven culture across your company, linking advertising performance to overall business objectives.
Automation, Dashboard Creation, and Long-Term Strategies
Your ROAS framework should scale with your advertising activities. Here's how to prepare for the future:
-
Explore Automation Opportunities: Automate tasks like data collection, reporting, and even certain campaign adjustments. This lets your team focus on higher-level strategy.
-
Create Dashboards for Real-Time Monitoring: Visual dashboards offer a quick overview of important ROAS metrics. You can rapidly spot issues and respond to performance shifts. Consider tools like Google Data Studio or other dashboarding software.
-
Develop Long-Term Measurement Strategies: As your advertising expands across channels and markets, your ROAS measurement strategy should adapt as well. This ensures accuracy and relevance as your business grows.
These strategies keep your ROAS framework effective and efficient as your advertising grows in complexity and scale.
Ready to improve your digital advertising performance? Partner with Click Click Bang Bang, a full-service PPC agency focused on maximizing ROAS. We provide tailored strategies, transparent reporting, and a risk-free trial. Visit us today and see how we can help you reach your advertising goals.
Read NeXt
Or Read Our Latest
- SEO Cost Australia 2026: Your Guide to Pricing
- Offline Conversion Tracking: Guide for AU Businesses 2026
- How to Start Advertising on LinkedIn: 2026 Guide
- 7 B2B LinkedIn Ad Examples to Steal in 2026
- 7 Best Google Ads Managers in Australia for 2026
- Customer Data Platform Guide: Boost ROI & Meet AU Privacy
Click. CLick. Subscribe.
Get our best PPC insights, industry updates, and power moves delivered straight to your inbox. No fluff, just high-caliber strategies that actually work.
Don’t Leave Just Yet
Try Us For 30-Days,
Risk Free!!
We guarantee that you’ll love our work within the first 30 days, if not you’ll get your money back.
What have you got to lose?