

Mastering Digital Marketing Performance Metrics
Last Updated

Digital marketing metrics are the only things that give you clarity, justify your budgets, and steer your entire strategy. Without them, you’re basically marketing with a blindfold on, just hoping you hit the mark. These numbers are what turn vague goals into a real, tangible roadmap for growth.
Why Performance Metrics Are Your Marketing Compass
Launching a campaign in today's crowded digital world without tracking metrics is like setting sail without a compass. Sure, you’re moving, but you have no clue if you’re heading towards your destination or drifting straight into a storm. Digital marketing performance metrics aren't just numbers on a screen; they are the vital signs that tell you what’s working, what’s failing, and where your money is actually making an impact.
Relying on 'gut feel' is a surefire way to burn through your budget. The alternative is a data-driven approach, where every single decision is backed by real performance. This mindset shifts your focus from just doing marketing to achieving real-world business outcomes. It’s the difference between being busy and being effective.
The High Cost of Ignoring Data
The opportunity cost of ignoring data is massive, especially when things are this competitive. Digital ad spend in Australia hit a staggering $4.2 billion for the March 2025 quarter alone—that's an 11.6% jump from the previous year. With 97.1% of the population online, the battle for attention is fierce, making every single marketing dollar count.
By tracking the right metrics, you move from guessing to knowing. You can confidently answer questions like, "Which channel is bringing in the most sales?" or "Is our new ad creative actually connecting with our audience?" This clarity empowers you to double down on what works and cut your losses on what doesn't.
For anyone just dipping their toes in, a good beginners guide to digital marketing can give you the foundational knowledge needed to get started in this data-centric world.
From Vague Goals to a Clear Roadmap
Metrics take fuzzy objectives like "increase brand awareness" or "get more leads" and make them concrete and measurable. For example, a goal to boost awareness can be tracked with metrics like Impressions and Reach. A goal to generate leads is measured by Conversion Rate and Cost Per Lead.
This is what a typical analytics dashboard looks like, giving you a visual snapshot of your key performance indicators.
This snapshot immediately shows you user activity, conversion events, and revenue, letting you quickly check the health of your campaign. By translating your goals into hard numbers, you can easily see how you're progressing. You can explore our guide on effective marketing KPI dashboard examples to see how this data really comes to life.
At the end of the day, performance metrics are your compass, guiding every strategic move you make towards real, sustainable growth.
A Simple Framework for Understanding Your Metrics
The world of digital marketing performance metrics can feel like trying to drink from a firehose. With dozens of data points flooding your dashboards, it’s easy to get lost in the noise and lose sight of what actually moves the needle. To cut through the clutter, you need a simple, logical way to organise it all.
Imagine you're a chef. Your success isn't determined by a single action but by a sequence of steps, from sourcing quality ingredients to the cooking process and, finally, the finished meal. Marketing metrics work the same way. We can group them into three distinct tiers that tell the complete story of your campaign's journey from first impression to final sale.
This hierarchy is brilliant because it helps you see how top-level actions (like getting your ad seen) connect directly to bottom-line business results (like making money). It gives you a clear structure to diagnose problems and pinpoint opportunities with surgical precision.
This infographic breaks down how tying your metrics back to clear goals lays the foundation for real, sustainable business growth.
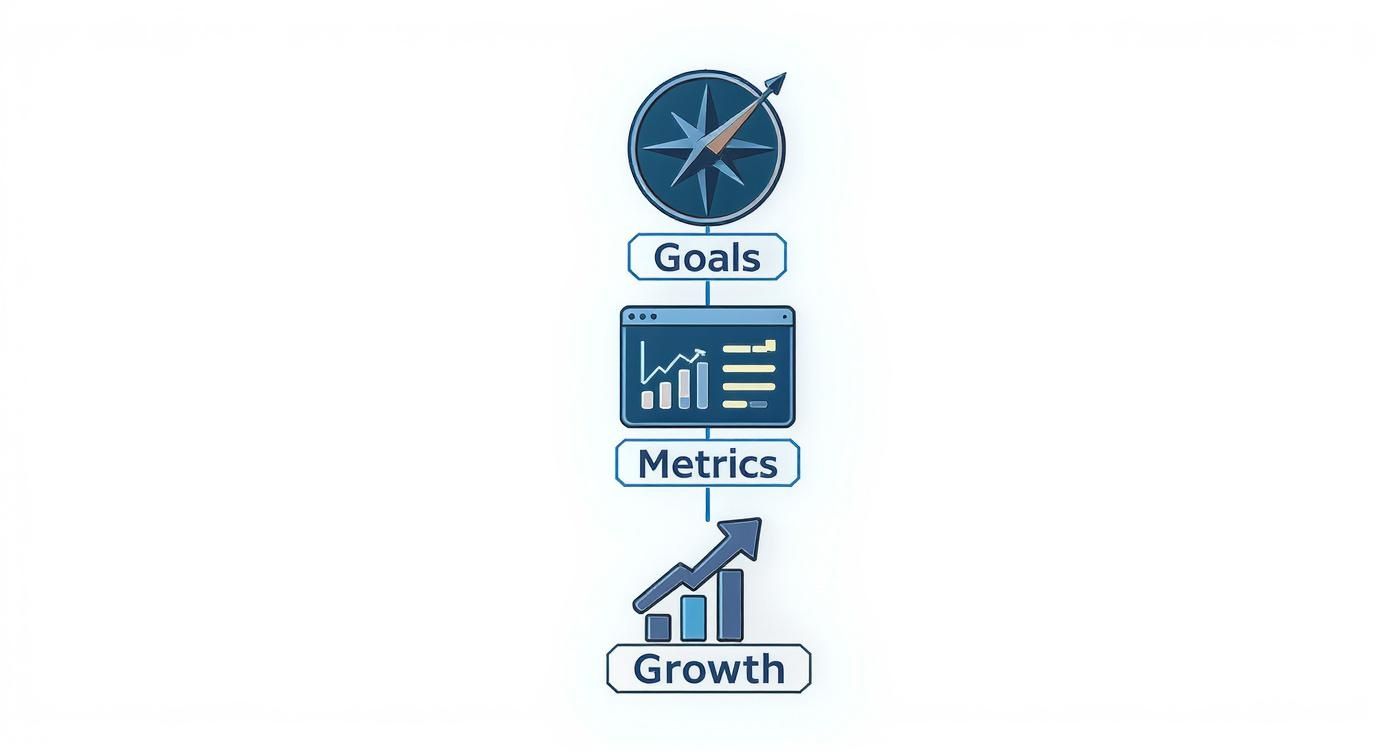
As you can see, when your business goals guide your choice of metrics, the result is measurable growth you can bank on.
To help you get organised, we can break everything down into three distinct tiers. This table gives a quick overview before we dive into the details of each one.
The Three Tiers of Digital Marketing Metrics
A clear breakdown of the metric tiers, their purpose, and key examples to help you organize your data.
| Metric Tier | What It Tells You | Key Examples |
|---|---|---|
| Tier 1: Foundational | "How many people are we reaching?" | Impressions, Reach, Frequency |
| Tier 2: Performance | "Are people engaging with our marketing?" | Clicks, CTR, CPC, Engagement Rate |
| Tier 3: Outcome | "Did our marketing drive real business value?" | Conversions, CPA, Conversion Rate, ROAS |
This structure makes it much easier to see the cause-and-effect relationship between different data points. Now, let's explore each tier.
Tier 1: Foundational Metrics
Think of Foundational Metrics as your raw ingredients. These are your top-of-funnel numbers that represent the total potential audience for your campaign. They don't measure success on their own, but without them, you have nothing to work with.
These metrics simply answer the question: "How many people are we reaching?"
The two most common examples here are:
- Impressions: The total number of times your ad was displayed on a screen.
- Reach: The number of unique individuals who saw your ad at least once.
A high number of impressions is a great start—it’s like having all your fresh ingredients laid out on the countertop. But it's just the beginning of the story.
Tier 2: Performance Metrics
Performance Metrics represent the cooking process. Now that you have your ingredients, how well are you actually using them? These mid-funnel metrics measure engagement and tell you how well your audience is responding to your creative and messaging.
They answer the question: "Are people engaging with our marketing?"
This tier is where you start to find out if your creative and targeting are hitting the mark. Strong performance metrics show that your message is resonating with the right people, turning potential interest into active engagement.
You'll spend a lot of time looking at these:
- Click-Through Rate (CTR): The percentage of people who saw your ad and actually clicked on it. A high CTR is a fantastic sign that your ad copy and visuals are compelling.
- Cost Per Click (CPC): The average amount you pay for each of those clicks. A lower CPC means you're getting traffic to your site more efficiently.
- Engagement Rate: For social media, this is the percentage of your audience that interacts (likes, shares, comments) with your content.
These numbers tell you if your cooking technique is sound. A high CTR is like a perfectly seared steak—it shows the process is working exactly as intended.
Tier 3: Outcome Metrics
Finally, Outcome Metrics are the finished meal—the tangible business results your campaign generated. These are the bottom-of-funnel metrics that directly connect your marketing spend to revenue and growth. They are, without a doubt, the ultimate measure of success.
These metrics answer the most important question of all: "Did our marketing drive real business value?"
The most critical outcome metrics include:
- Conversion Rate: The percentage of visitors who completed a desired action, like making a purchase or filling out a form.
- Cost Per Acquisition (CPA): The total cost to acquire one new customer or lead. This tells you how much you're spending to get a result.
- Return on Ad Spend (ROAS): The holy grail. This is the total revenue generated for every dollar spent on advertising. A 4:1 ROAS, for example, means you made $4 for every $1 you spent.
When you organise your digital marketing metrics into this three-tiered framework—Foundational, Performance, and Outcome—you create a logical narrative. You can clearly see how the quality of your ingredients (Tier 1) impacts the efficiency of your cooking (Tier 2), which ultimately determines the success of your finished meal (Tier 3).
Decoding Essential PPC Campaign Metrics

If foundational metrics tell you how many people you’re reaching, performance metrics tell you if any of them actually care. Specifically for Pay-Per-Click (PPC) campaigns, these are the numbers that connect the dots between getting seen and getting results.
Think of them as the diagnostic tools for your advertising engine. They help you pinpoint exactly what’s firing on all cylinders and what’s just sputtering out. Looking at these numbers individually is helpful, but their real power comes alive when you see them as a whole. They tell a story about your campaign’s health, revealing insights that one isolated data point could never offer. A sky-high click rate doesn't mean much if each click costs a fortune and never leads to a sale.
It's in this interconnected story that you'll find your biggest opportunities to optimise. By getting a solid grip on a few core PPC metrics, you can shift from just spending money on ads to strategically investing in measurable growth.
Click-Through Rate (CTR): Your Ad’s First Impression
Your Click-Through Rate (CTR) is simply the percentage of people who saw your ad and were compelled enough to actually click on it. The maths is easy: divide the total number of clicks by the total number of impressions. A high CTR is a fantastic sign that your ad copy, creative, and targeting are all hitting the right notes with your audience.
Let's say you're running two different ads for a new pair of running shoes in Sydney.
- Ad A: Gets a CTR of 1.2%
- Ad B: Pulls in a CTR of 4.5%
It’s pretty obvious Ad B is the winner here. Its message and visuals are doing a much better job of grabbing attention and sparking interest. A low CTR, on the other hand, is your first red flag that something's off. It could be a weak headline, a boring offer, or you might just be showing it to the wrong crowd.
Cost Per Click (CPC): The Price of a Visitor
While CTR tells you how interesting your ad is, Cost Per Click (CPC) tells you how efficient it is. This metric shows the average amount you fork out every single time someone clicks your ad. Generally, the aim is to keep this number as low as possible without sacrificing the quality of the traffic coming to your site.
A high CPC isn't automatically a bad thing, especially if it's bringing in high-value customers who spend a lot. But a CPC that keeps creeping up can drain your budget in a hurry. Keeping a close eye on this number helps you understand how competitive your keywords are and whether your ad quality is strong enough to earn a lower cost from platforms like Google.
A healthy balance between CTR and CPC is the sweet spot for PPC success. You want ads that are compelling enough to earn clicks (high CTR) but efficient enough that those clicks don't break the bank (low CPC).
Understanding how your costs stack up against the competition is vital. For a clearer picture, check out some detailed reports on Google Ads benchmarks by industry to see if your performance is on the right track.
Conversion Rate: The Moment of Truth
Clicks are great, but they don't pay the bills. The Conversion Rate is where the magic happens. It’s the percentage of people who clicked your ad and then went on to complete a valuable action on your website—like making a purchase, signing up for a newsletter, or filling out a contact form. This is easily one of the most critical digital marketing performance metrics because it directly measures results.
This is where the plot often thickens. You might have a killer CTR of 8%, but if your conversion rate is a measly 0.5%, something is broken after the click. This classic scenario usually points to a jarring disconnect between what your ad promised and what your landing page delivered. Maybe the page is confusing, the offer isn't clear, or it's just painfully slow to load.
Cost Per Acquisition (CPA): Your True Cost of Success
Finally, there's Cost Per Acquisition (CPA), sometimes called Cost Per Action. This metric ties everything together, measuring the total average cost to get one new customer or lead from your campaign. To figure it out, just divide your total ad spend by the number of conversions.
While CPC tells you what a click costs, CPA tells you what a result costs. This number is the ultimate judge of your campaign's financial health. If you sell a product for $100 but your CPA is $120, you've got a serious problem on your hands. On the flip side, a CPA of $25 for that same $100 product is a recipe for profitable growth. To get a better handle on using data to fine-tune your ad campaigns, it's worth exploring the concept of paid search intelligence.
As Australia's digital marketing market continues its massive expansion—projected to nearly double from $13.03 billion USD in 2024 to $25.39 billion USD by 2034—the pressure to show a clear return on investment will only get more intense. Mastering these core PPC metrics isn't just good practice anymore; it's absolutely essential for survival and success in a crowded market.
Measuring Real Impact on Social Media
Vanity metrics like follower counts and likes are great for the ego, but they don't pay the bills. They won't tell you if your social media efforts are actually making a dent in your bottom line. Success on platforms like Facebook, Instagram, and TikTok isn't about winning a popularity contest; it's about turning audience attention into real, measurable business results.
To get there, you need to look past the surface-level numbers and focus on performance metrics that measure genuine impact.
Think of likes and shares as applause at a show. It’s nice to hear, but it doesn't guarantee the audience will buy a ticket for your next performance. We need to dig deeper into the data that connects social activity directly to business goals, helping you understand the true return on your investment.
The stakes are getting higher every year. Social media advertising in Australia is a juggernaut, with spending projected to hit a whopping AUD 7.5 billion by 2025. That accounts for nearly 29% of the entire digital advertising market, which tells you just how critical it is for businesses to get this right. You can find more insights into the Australian marketing landscape on eloquent.com.au.
Engagement Rate: The Pulse of Your Audience
The Engagement Rate is one of the most honest metrics you can track on social media. It cuts through the noise and tells you what percentage of your audience is actively interacting with your content—think likes, comments, shares, and saves. It’s a direct reflection of how well your content is resonating with the people you’re reaching.
A high engagement rate is a great sign; it suggests your content is relevant, valuable, and sparking a genuine connection. On the flip side, a low rate is a clear warning that your messaging is falling flat or, just as likely, you're talking to the wrong crowd.
A high engagement rate without conversions is a classic red flag. It often means you're creating fantastic brand awareness content but failing to guide that interest towards a sale. Your content is entertaining, but it isn't compelling anyone to act.
Calculating it is simple: just divide the total number of engagements by your total followers (or by your reach, for a more post-specific view) and multiply by 100. This number is your content’s pulse.
Ad Frequency: Finding the Sweet Spot
Ad Frequency measures the average number of times a unique user sees your ad within a set period. Getting this right is a delicate balancing act. You need to show your ad multiple times for it to stick in someone's mind and prompt action, but there’s a very fine line between effective repetition and just being annoying.
It’s like hearing a new song on the radio. The first few listens, you might start tapping your foot. But after hearing it twenty times in a single day, you’ll be lunging for the dial. This is ad fatigue, and it’s a budget killer.
When your frequency gets too high, you’ll almost always see performance start to tank:
- Click-Through Rates (CTR) plummet as people begin to tune out your ad.
- Cost Per Click (CPC) can creep up as the platform has to work harder to get it seen.
- Negative feedback (like users hiding your ad) often starts to climb.
Keeping a close eye on frequency helps you keep your campaigns fresh and efficient, ensuring you're reminding your audience, not irritating them. Understanding the budget implications is vital, so it's always a good idea to explore detailed breakdowns of social media advertising costs to manage your spend effectively.
Return on Ad Spend (ROAS): The Ultimate Verdict
Finally, we get to the metric that truly matters for business growth: Return on Ad Spend (ROAS). This is the big one. It tells you exactly how much revenue you've generated for every single dollar you spent on advertising. It cuts through all the fluff and gives you a clear, financial verdict on your campaign's success.
The formula is beautifully straightforward: Total Revenue from Ads / Total Ad Spend.
Let's say an Australian retail brand spends $2,000 on an Instagram campaign to promote a new swimwear line. That campaign directly generates $10,000 in sales.
Their ROAS would be $10,000 / $2,000 = 5. This is usually expressed as a 5:1 ratio, meaning for every $1 they put in, they got $5 back. This single number instantly proves the campaign wasn't just busy—it was highly profitable.
Turning Your Data Into Smarter Decisions

Understanding your digital marketing performance metrics is one thing; actually using them to make smart, money-making decisions is another game entirely. This is where theory hits the road. Data is just a bunch of numbers on a screen until you translate it into a clear plan of attack—one that drives real results.
The trick is to stop just reporting on metrics and start diagnosing them. Think of yourself as a campaign doctor. You don't just note a high temperature; you figure out why it's high and prescribe the right treatment. This "if this, then that" logic is the engine of great campaign optimisation. It lets you systematically fix what's broken and double down on what's working.
Let's walk through a common scenario to see how this diagnostic process plays out in the real world. Imagine you're running a Google Ads campaign for an e-commerce store in Australia, and your results are falling flat. By digging into the metrics, you can find the root cause and roll out a targeted fix.
Scenario A: Low Click-Through Rate (CTR)
You log into your dashboard and the first thing you see is a dismal Click-Through Rate (CTR) of 0.8%, way below the industry average. That’s your first major clue.
A low CTR tells you there's a disconnect. People are seeing your ad, but they just aren't compelled enough to click. The problem almost always points back to your ad creative, headline, or targeting. The solution isn't to panic and scrap the whole campaign, but to figure out the specific weakness.
Here’s your action plan:
- Review Ad Copy: Is your headline specific and benefit-driven, or is it vague? Does the description have a clear call-to-action (CTA)? An ad for "Running Shoes" is background noise; "Free Shipping on Nike Air Zoom in Australia" is an attention-grabber.
- Analyse Keyword Relevance: Are your ads showing up for the right searches? If you sell premium running shoes but you're bidding on "cheap sneakers," your CTR will tank because you're attracting the wrong crowd.
- Test Different Ad Variations (A/B Testing): Set up two versions of your ad with one key difference. Maybe one headline focuses on price ("20% Off Today"), while the other highlights a feature ("Lightest Running Shoe Ever"). Let the data tell you which message truly resonates.
By systematically testing these elements, you can pinpoint the exact reason for the low CTR and make changes backed by actual data.
Scenario B: Skyrocketing Cost Per Acquisition (CPA)
Now for another classic problem. Your CTR is looking healthy, maybe around 4%, but your Cost Per Acquisition (CPA)—what you pay for a single sale—is $90. Ouch. Since your product only sells for $75, you're literally losing money on every conversion.
A high CPA despite a good CTR is a massive red flag. It tells you the problem isn't getting people to your site; the problem is what happens after they click. You're paying for interested visitors who just aren't converting.
This issue almost always comes down to two things: poor audience targeting or a weak landing page experience. You’re either attracting clicks from people who were never going to buy, or your website is failing to persuade the right people when they arrive.
To wrestle that high CPA back down, you need to investigate the post-click journey:
- Refine Your Audience Targeting: Are you casting the net too wide? Use negative keywords to filter out irrelevant searches. For instance, adding "jobs" or "reviews" as negative keywords stops you from paying for clicks from job seekers or researchers who have no intention of buying.
- Optimise the Landing Page: Does the landing page deliver on the promise made in your ad? If your ad screams "50% Off Sale," that offer needs to be the very first thing visitors see. No exceptions.
- Improve Page Speed and Mobile Experience: A slow-loading page is a conversion killer. Use Google's PageSpeed Insights to see how you stack up. With over 70% of web traffic now coming from mobile, a clunky, hard-to-navigate mobile site will send your CPA through the roof.
By moving past simply observing your digital marketing performance metrics and adopting a diagnostic mindset, you can start making smarter, more profitable decisions. This methodical approach turns data from a passive report into an active tool for maximising your return on investment.
Common Questions About Marketing Metrics
Diving into the world of digital marketing metrics can feel a bit like learning a new language. You start to get the individual words, but figuring out how they all fit together into a coherent sentence is the real challenge. This section is here to clear up some of the most common points of confusion with practical, straightforward answers.
Think of this as your go-to guide for those nagging questions that pop up when you're staring at a dashboard full of data. The goal is to build your confidence so you can analyse your campaigns with clarity and make smarter decisions backed by a solid understanding.
What Is the Difference Between a Metric and a KPI?
This is easily one of the most frequent questions we get, and the distinction is crucial for staying focused on what actually matters.
Imagine you're on a road trip from Melbourne to Perth. Along the way, you’re tracking dozens of data points.
A metric is any single piece of data you can measure. On your road trip, this would be things like your current speed, the engine temperature, or how many kilometres you've driven in the last hour. In marketing, metrics are things like clicks, impressions, and website traffic. They're all useful pieces of information, no doubt.
A Key Performance Indicator (KPI), on the other hand, is a specific metric you’ve hand-picked because it directly measures your progress towards a critical goal. For your road trip, the ultimate goal is reaching Perth. So, your most important KPI would be "kilometres remaining until destination." It's the one number that tells you, unequivocally, if you're succeeding.
In short, all KPIs are metrics, but only a handful of the most important metrics earn the title of KPI. A KPI is a metric that’s directly tied to a major business objective, like "new leads from organic search" or "customer acquisition cost," because these directly impact your bottom line.
How Often Should I Check My Marketing Metrics?
There’s no single right answer here—it all comes down to the pace of your campaign and the nature of the metric itself. Checking everything daily can lead to data overload and knee-jerk reactions, while checking too infrequently means you could miss critical issues until it's too late.
The best approach is to find a rhythm based on how volatile and important each metric is.
- Daily Checks: This is essential for fast-moving paid ad campaigns. You’ll want to keep a close eye on performance metrics like Cost Per Click (CPC) and Click-Through Rate (CTR). A sudden spike in CPC can drain your budget in a matter of hours, so daily monitoring is your first line of defence.
- Weekly Checks: This cadence is ideal for tracking broader trends and mid-level goals. It’s perfect for reviewing SEO keyword rankings, social media engagement rates, and lead generation figures. It provides enough data to spot meaningful patterns without getting lost in daily noise.
- Monthly Reviews: Save these for your big-picture, outcome-focused metrics. Things like Return on Ad Spend (ROAS), Customer Lifetime Value (CLV), and overall channel performance are best analysed monthly. This gives you a strategic, 30,000-foot view of your marketing's true financial impact.
The key is to build a reporting schedule that keeps you informed enough to act decisively, but not so buried in data that you lose sight of the bigger picture.
Which Metrics Matter Most for a Small Business?
For a small business, every dollar and every minute has to count. While metrics like reach and brand impressions are nice to have, they don't directly keep the lights on. Your focus should be relentlessly practical, aimed squarely at the metrics that have a clear and immediate impact on your financial health.
If you’re running a small business in Australia, these are the three digital marketing performance metrics you should prioritise above all others:
- Conversion Rate: This tells you what percentage of your website visitors are taking the action you want them to take—whether that's making a purchase, filling out a contact form, or signing up for a trial. A high conversion rate means your marketing message and website experience are working together to turn interest into action. It's that simple.
- Cost Per Acquisition (CPA): This is the total cost to gain one new, paying customer. It’s a brutally honest metric that tells you precisely how much you have to spend to win a sale. Keeping your CPA well below the average value of a customer is absolutely fundamental to building a profitable business.
- Return on Ad Spend (ROAS): This is the ultimate verdict on your advertising efforts. For every single dollar you put into an ad campaign, how many dollars in revenue did you get back? A ROAS of 4:1 means you’re generating $4 for every $1 spent—a clear sign of a campaign that's pulling its weight.
By zeroing in on these outcome-driven metrics, you can make sure your marketing efforts aren't just creating activity, but are actively contributing to sustainable, profitable growth.
At Click Click Bang Bang, we specialise in turning complex data into clear, profitable strategies for businesses across Australia. If you're ready to move beyond confusing dashboards and start making data-driven decisions that boost your bottom line, we can help. Explore our SEO and PPC services to see how we deliver precision-driven campaigns with transparent, real-time results.
Read NeXt
Or Read Our Latest
- How to Set Up Google Ads in Australia: Complete 2026 Guide
- Google Merchant Center Setup: The Complete 2026 Guide
- Business Manager Setup Facebook: The Complete 2026 Guide
- Google Ads Account Setup: Expert Guide for 2026
- Search Ads Optimisation: A Practical Guide for 2026
- Manual vs Automated Bidding for PPC Success
Click. CLick. Subscribe.
Get our best PPC insights, industry updates, and power moves delivered straight to your inbox. No fluff, just high-caliber strategies that actually work.
Don’t Leave Just Yet
Try Us For 30-Days,
Risk Free!!
We guarantee that you’ll love our work within the first 30 days, if not you’ll get your money back.
What have you got to lose?