Sales Growth Rate: Calculate & Boost Your Business
Last Updated

You're probably looking at a revenue report right now that seems positive on the surface. Sales are up from the last campaign, the Shopify dashboard looks healthy, and your PPC account has produced conversions. But one question still hangs over the whole thing. Is the business growing, or did you just create a short-term spike?
That's where sales growth rate becomes useful. It turns a vague sense of momentum into a comparable business metric. Beyond this, it gives marketing teams a way to connect SEO, paid media, lead generation, and conversion work to the one outcome that matters most: revenue moving in the right direction for the right reasons.
Beyond Revenue The True Meaning of Sales Growth
A business owner can have two very different months and still see the same top-line revenue result. One month comes from steady demand, strong conversion paths, and repeat buyers. The other comes from heavy discounting, urgent promotions, and a burst of branded search traffic that disappears the moment spend is reduced.
Both months produce revenue. Only one reflects durable growth.
That distinction is why sales growth rate matters. It measures change between comparable periods, which makes it easier to judge business momentum instead of reacting to raw sales totals. In practice, this is what stops teams from over-celebrating a sale period that damaged margin, or underestimating a campaign that created better long-term customer quality.
A useful Australian example sits outside your own dashboard. The Australian Bureau of Statistics tracks retail turnover as a broad proxy for consumer sales activity. It reported A$37.6 billion in monthly retail trade in May 2024, and also reported a 0.1% month-on-month fall after a 0.2% rise in April, which shows how quickly a headline number can shift and why context matters across different states and trading conditions in the ABS retail turnover reporting summarised here.
Revenue alone can hide the real story
If your Google Ads account drove more purchases this month, that sounds good. But if those purchases came from discount-led shopping, low-margin products, or returning customers who were already likely to buy, the growth story changes.
The same problem appears in lead generation. A B2B campaign can produce more form fills and still fail to improve sales growth if the pipeline is full of poor-fit leads that don't progress.
Practical rule: Revenue tells you what happened. Sales growth rate helps you compare whether it happened better, worse, or simply differently than before.
Why marketers should care
Finance teams often treat sales growth rate as a boardroom metric. Marketers should treat it as an operating metric.
When you connect campaign activity to sales growth rate, you can answer better questions:
- Which channels produced real commercial lift
- Which campaigns created short-term volume without lasting value
- Whether SEO is contributing compounding demand or just branded traffic
- Whether PPC is accelerating profitable growth or buying expensive transactions
That shift matters. Good reporting doesn't stop at clicks, leads, or ROAS. It shows whether marketing is contributing to reliable revenue growth that the business can repeat.
How to Calculate Your Sales Growth Rate
The core formula is straightforward. What trips people up isn't the maths. It's using inconsistent periods and then drawing confident conclusions from bad comparisons.
The standard formula is:
(Current Period Sales – Previous Period Sales) ÷ Previous Period Sales × 100
Industry guidance stresses using like-for-like periods so you don't compare mismatched trading windows, especially across Australian retail cycles and campaign periods, as outlined in this explanation of the sales growth rate formula and period alignment.
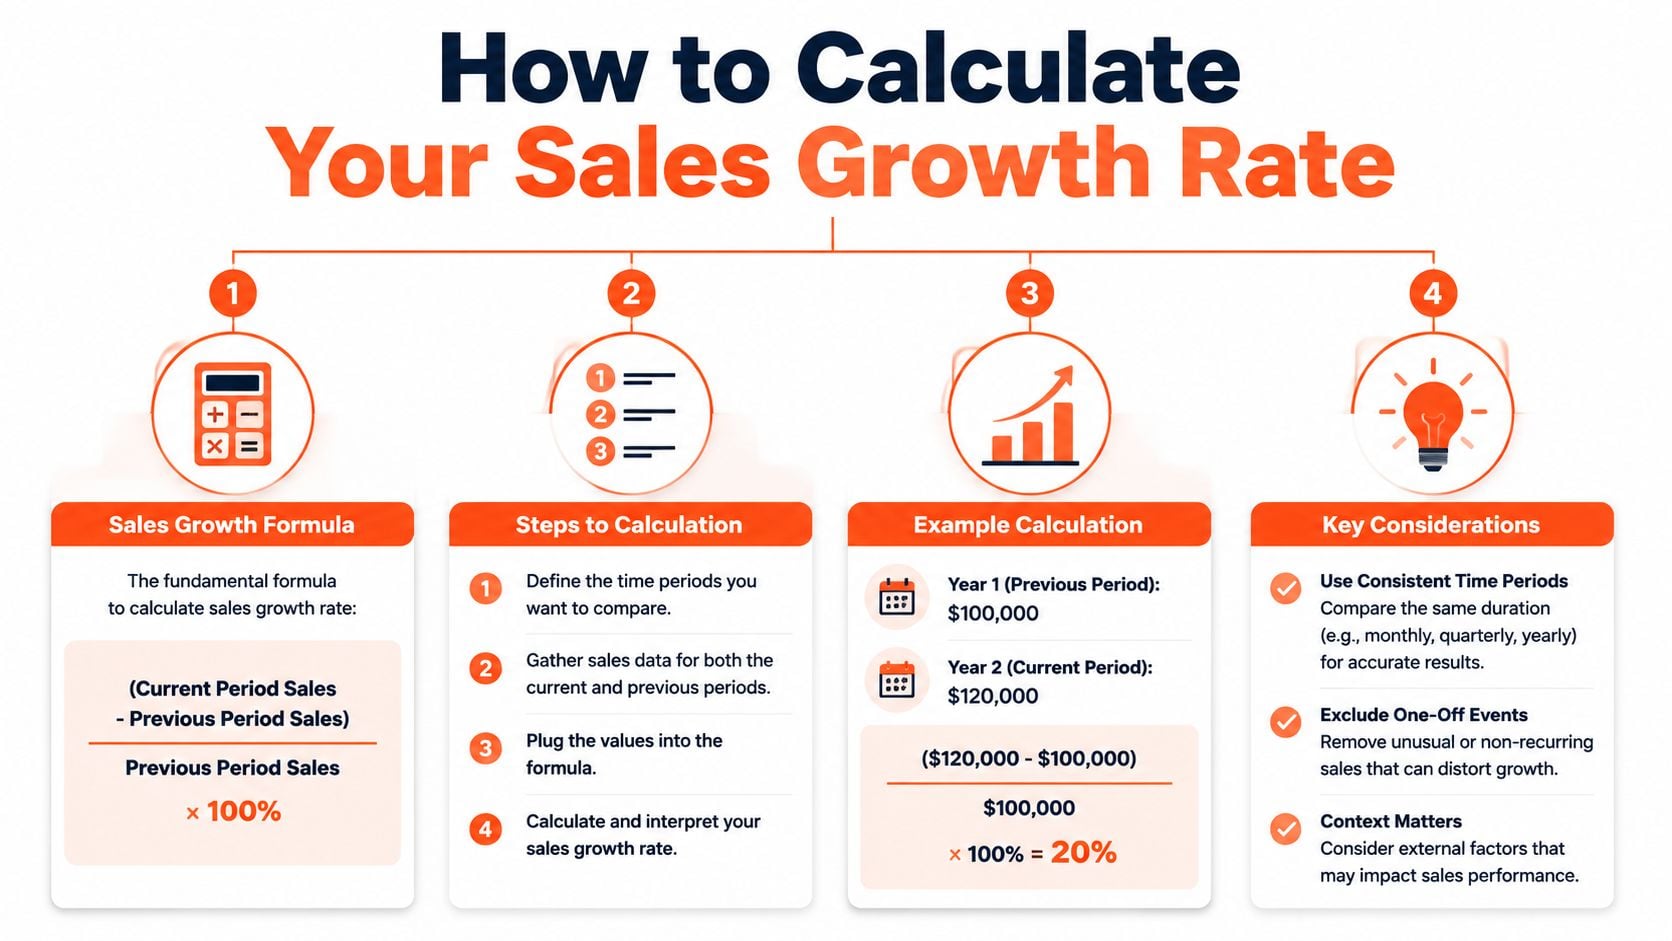
The formula in plain language
You take the sales from the current period, subtract the sales from the previous comparable period, divide that result by the previous period's sales, then multiply by 100.
You can use this for month-over-month, quarter-over-quarter, or year-over-year reporting. The structure stays the same. Only the comparison period changes.
How to apply it in real reporting
Use this order every time:
- Pick the period first. Decide whether you're comparing months, quarters, or years.
- Check comparability. Match the same type of period. Don't compare a full quarter against a promotional month.
- Use net sales consistently. If you include refunds, returns, or cancelled orders in one period, handle them the same way in the other.
- Document anomalies. A stock outage, site migration, or one-off partnership can distort the result.
Which version to use
Here's the practical way to think about each comparison type.
| Comparison type | Best use | Main risk |
|---|---|---|
| MoM | Short-term campaign monitoring | Too volatile during seasonal swings |
| QoQ | Operational planning and budget pacing | Can still be distorted by trading events |
| YoY | Strategic performance review | Slower to reflect recent campaign changes |
Month-over-month for campaign checks
Month-over-month is useful when you've launched a new landing page, expanded shopping campaigns, or changed bidding strategy. It helps you spot direction quickly.
But it's noisy. A strong sale period can make the next month look weak even when the business is healthy.
Quarter-over-quarter for management decisions
Quarter-over-quarter smooths some of the noise out. It's often more useful for budget allocation, sales planning, and broader channel review.
Many businesses start seeing whether PPC and SEO are helping across a full planning cycle, not just around launch periods.
Year-over-year for real business momentum
Year-over-year is the most useful comparison when seasonality matters. It compares the same period against the same period in the prior year, which makes it harder for holiday spikes, EOFY promotions, or event-driven surges to mislead you.
Compare like with like. The closer the trading conditions match, the more trustworthy your sales growth rate becomes.
What Your Sales Growth Rate Is Really Telling You
A positive sales growth rate isn't automatically good news. It can signal stronger demand, better marketing-market fit, and cleaner execution. It can also mean you dropped prices, increased promotional pressure, or expanded distribution in a way that inflated revenue without improving business quality.
That's why interpretation matters more than the calculation.

Healthy growth versus noisy growth
The most useful question isn't “Did sales increase?” It's “Why did they increase?”
Recent retail guidance highlights a key problem with headline growth metrics. Sales growth can overstate true demand if you don't separate price, promotion, and channel mix from genuine customer demand, particularly when basket behaviour and local dynamics are changing, as discussed in this analysis of price, promo, and mix effects on growth.
Here's how that plays out in marketing:
- Healthy growth usually shows up with improving conversion quality, stronger repeat behaviour, and sales that remain stable after the campaign push eases.
- Noisy growth often comes from discounts, aggressive remarketing, or channel shifts that make numbers look better while profitability or customer quality slips.
Questions worth asking in every report
When a campaign appears to lift sales, review these variables before calling it a win:
- Pricing changes. Did revenue rise because customers bought more, or because prices changed?
- Promotional pressure. Did paid media scale demand, or did the offer carry the result?
- Product mix. Did growth come from high-value products or low-margin items?
- Channel movement. Did SEO create new demand, or did branded search capture people already on their way to buy?
- Geography and store nuance. If you trade across regions, local demand can move very differently.
A client report gets sharper when you combine sales growth rate with acquisition economics. If spend rises faster than revenue quality, the business may be buying growth at a poor price. This is why a working understanding of customer acquisition cost in marketing reporting belongs beside sales growth analysis.
A rising sales growth rate is only reassuring when the business can explain what caused it and whether that cause is repeatable.
What doesn't work
What fails most often is treating every increase as proof that the strategy worked. It doesn't.
Three habits create bad interpretation:
| Mistake | Why it causes problems | Better approach |
|---|---|---|
| Looking at one period in isolation | It ignores context and trading conditions | Compare against a matched period and review surrounding trends |
| Reporting only aggregate sales | It hides mix, pricing, and segment changes | Break sales down by channel, category, and customer type |
| Ignoring efficiency metrics | Revenue can grow while economics worsen | Review growth beside margin, CAC, and conversion quality |
The strongest teams don't just report growth. They diagnose it.
Tracking and Visualising Sales Growth in Marketing Reports
Sales growth rate shouldn't sit in a finance file that marketing sees once a quarter. It belongs in the same dashboard as ad spend, SEO visibility, conversion rate, lead quality, and revenue by channel.
That's how you move from descriptive reporting to operational reporting.
Build one reporting flow
For e-commerce, the cleanest setup usually starts with platforms such as Shopify, WooCommerce, or BigCommerce. For lead generation, the data often sits across a CRM, invoicing platform, and ad accounts. In both cases, the goal is the same. Pull actual sales data into one reporting layer, then align it with campaign inputs.
Looker Studio is a common choice because it can bring together GA4, Google Ads, Search Console, CRM exports, and commerce data. The specific tool matters less than the reporting discipline.
Use one source of truth for each field:
- Sales source for revenue and order values
- CRM source for lead status and pipeline progression
- Ad platform source for spend and click data
- Analytics source for sessions, assisted conversions, and landing-page behaviour
What to put on the dashboard
A useful dashboard doesn't need dozens of widgets. It needs the right comparisons.
Include charts that show:
- Sales growth trend over time alongside PPC spend
- Organic traffic trend beside non-branded conversions
- Lead volume and qualified lead movement for B2B accounts
- Revenue by channel to separate brand capture from true acquisition
- Landing-page conversion rate so you can explain why growth rose or stalled
A strong reference point for the wider reporting structure is this guide to digital marketing performance metrics that matter in practice.
Visuals that actually help decision-making
The best chart for this KPI is rarely a single number tile. Use trend lines and overlays instead.
A practical dashboard view might include:
- A rolling sales chart that shows whether growth is strengthening or flattening
- A spend-versus-sales view to spot diminishing returns
- A channel contribution table with notes on campaign changes
- An annotations layer marking promotions, site releases, stock issues, or tracking changes
That final point matters. If nobody marks the moments where strategy changed, teams end up guessing why results moved.
Marketing dashboards should answer three questions fast. What changed, what likely caused it, and what should happen next.
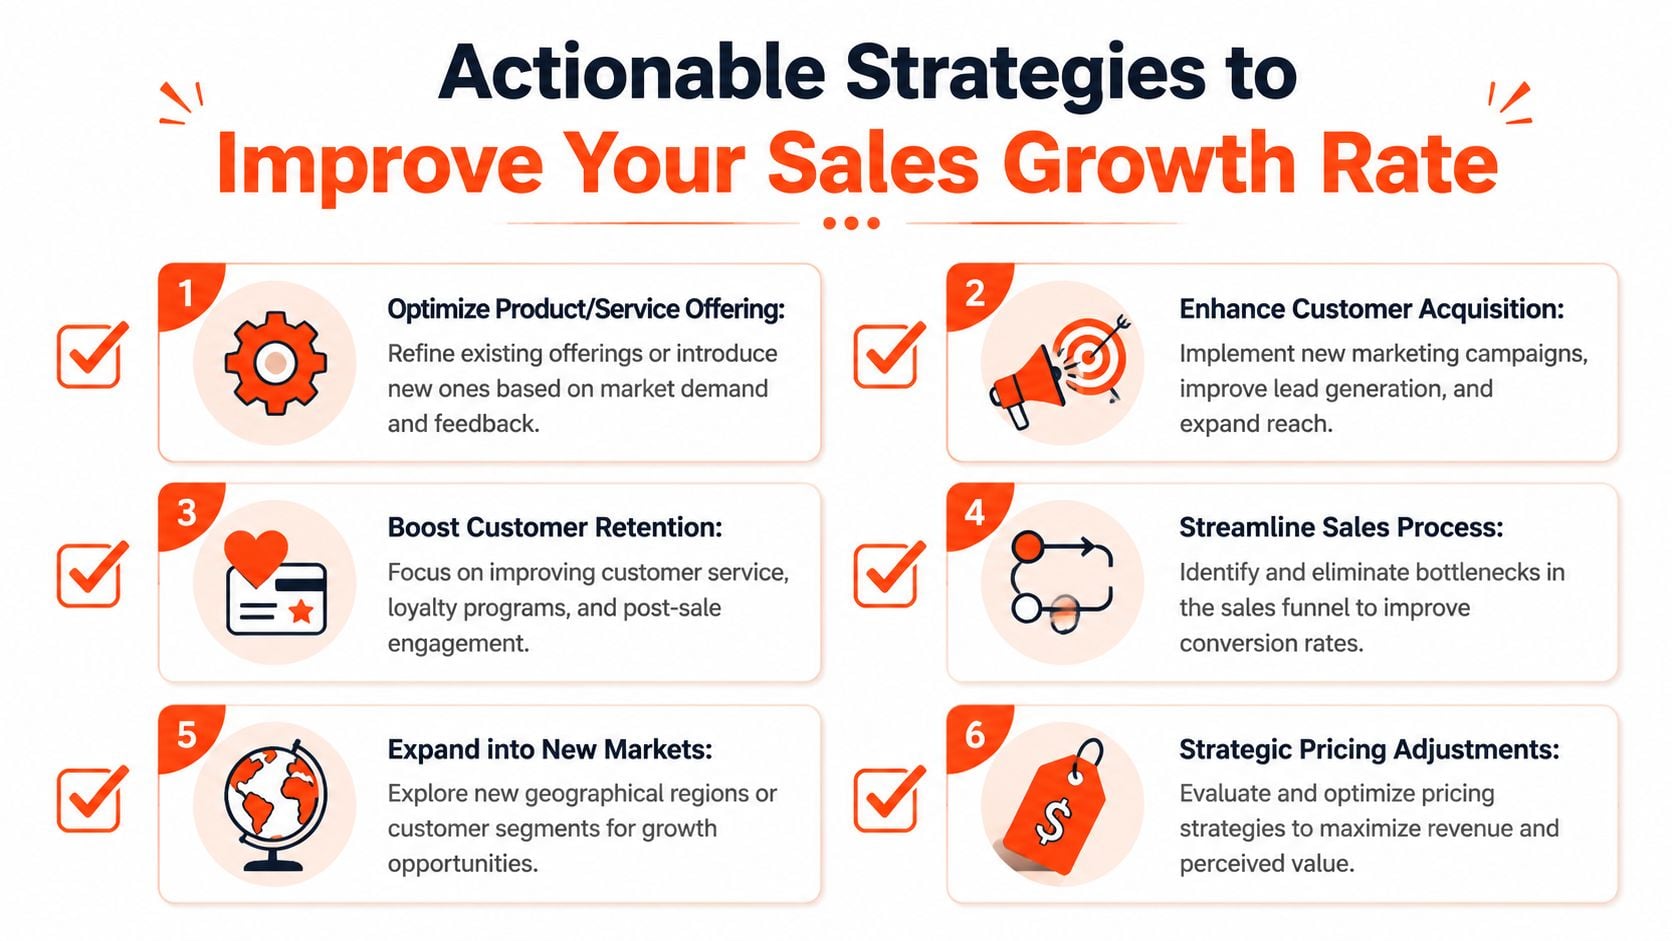
Actionable Strategies to Improve Your Sales Growth Rate
A flat sales growth rate usually points to one of three problems. You are buying the wrong traffic, losing demand on the page, or relying on low-quality revenue such as heavy discounting or branded demand that was already there.
That is why improvement work needs to start with the commercial constraint, not the channel. The right fix for an e-commerce store is different from the right fix for a B2B pipeline or a local service business, even if all three are spending on PPC and SEO.
For e-commerce brands
E-commerce growth improves fastest when teams stop treating all revenue as equal. A sale from a margin-killing promotion does not help the business the same way as a full-price sale from a new customer, and your marketing plan should reflect that.
Focus on these changes:
- Map campaigns to product intent. Split PPC by hero products, category terms, competitor terms, and remarketing. Blended campaign structures hide where profitable growth is coming from.
- Raise average order value without cutting too deep on price. Bundles, add-ons, and threshold offers usually hold margin better than broad discounting.
- Build SEO assets that support transactions. Collection pages, comparison pages, and buying guides often contribute more revenue than general top-of-funnel blog posts.
- Separate brand capture from acquisition. If branded search drives most sales growth, your prospecting engine may be weaker than the revenue line suggests.
- Fix tracking before you scale. Clean website conversion tracking for revenue reporting helps you see which campaigns are growing sales and which are only generating low-value orders.
Paid social deserves the same scrutiny. Creative, audience fit, and offer structure often change growth quality more than budget increases do. For teams refining that channel, AdStellar AI offers a useful reference on aligning message, offer, and audience intent for Facebook ads focused on sales.
One practical rule applies here. If sales only move when discounts get deeper, the growth issue usually sits in conversion friction, weak positioning, or poor audience selection.
Click Click Bang Bang works across PPC and AI-first SEO with live reporting and conversion tracking, which helps tie sales growth back to actual channel decisions instead of guesswork.
For B2B companies
B2B sales growth usually stalls between the click and the close. Marketing reports may show lead volume rising while revenue stays flat because the account list is too broad, the offer attracts poor-fit leads, or the follow-up process is too slow.
The fix is usually operational as much as promotional.
| Priority | What to change | Why it helps |
|---|---|---|
| Lead quality | Tighten targeting, sharpen the offer, and add qualification fields | Sales teams spend more time on accounts that can actually close |
| Sales velocity | Build landing pages, nurture flows, and follow-up sequences around common objections | More opportunities move forward instead of stalling after the first enquiry |
| Channel alignment | Match search, LinkedIn, retargeting, and content to buyer stage | Prospects get the right message at the point they are ready to act |
In practice, the strongest gains often come from reducing friction after the lead form. Faster response times, clearer booking steps, and better handoff rules can improve sales growth more than another round of top-of-funnel spend.
For SMBs and local operators
SMBs often chase broad reach when growth is really coming from a small set of high-value customer segments. A local service business might get plenty of enquiries, for example, but the profitable work may come from only a few service types, suburbs, or urgency levels.
That has clear implications for digital marketing. Segment campaigns by buying trigger, service need, geography, and customer value. Then write ads, build landing pages, and set budgets around the segments that produce profitable sales, not just volume.
Use this checklist:
- Identify your highest-value segment rather than the broadest audience
- Review search terms and lead quality to find patterns in intent
- Match offers to urgency or problem type instead of sending every click to one generic page
- Use remarketing and email follow-up to improve repeat business and close delayed demand
- Protect operational capacity and margin so growth does not create fulfilment problems that hurt retention
The common pattern across e-commerce, B2B, and SMBs is simple. Sales growth rate improves when marketing is measured against profitable revenue, channel by channel, and adjusted at the point where the buying journey is breaking.
Best Practices for Consistent Growth Tracking and Analysis
Most businesses don't have a sales growth problem. They have a tracking discipline problem.
When the reporting rhythm is weak, teams overreact to short-term swings, underinvest in what's working, and spend too long arguing about whose numbers are correct. Consistent growth tracking fixes that by turning sales analysis into an operating habit rather than a retrospective exercise.
Build a routine, not a rescue process
Use one agreed sales number. If finance, sales, and marketing each report different figures, trust disappears fast.
Then set a cadence:
- Weekly reviews for campaign and lead-flow changes
- Monthly reviews for channel contribution and conversion quality
- Quarterly reviews for budget shifts, market movement, and strategic priorities
For businesses affected by seasonality, industry guidance recommends year-over-year or rolling 12-month growth because it's more stable for planning and resource allocation than volatile month-over-month comparisons, especially around holiday and EOFY periods, as noted in this guidance on tracking sales growth over seasonal cycles.
Tie growth to the rest of the system
Sales growth rate should never sit alone. Review it next to CAC, margin, lead quality, and conversion tracking accuracy.
That last point is often overlooked. If your attribution is weak, your growth analysis will be weak too. Proper website conversion tracking is what lets you connect a rise in sales to the search term, ad set, landing page, or SEO page that influenced it.
Stable growth tracking doesn't remove uncertainty. It reduces avoidable confusion so teams can act faster.
What disciplined teams do differently
They don't wait for a bad quarter to inspect the numbers. They annotate campaign changes, document tracking updates, and review sales movements with enough context to make decisions.
They also avoid setting targets in a vacuum. A sales growth target only helps if the business can pursue it profitably, fulfil demand consistently, and keep measurement clean.
That's the core value of process. It turns a useful metric into a management tool.
Frequently Asked Questions About Sales Growth Rate

Is sales growth rate the same as revenue growth
Not always. Some businesses report gross sales, others report net sales, and many recognise revenue at different points depending on billing terms, fulfilment, or accounting rules. Returns, discounts, recurring revenue timing, and non-sales income can all shift the number.
For marketing reporting, the practical answer is consistency. Pick one definition that matches how the business measures commercial performance, then use that same definition across SEO, PPC, and sales reporting so channel trends can be compared with confidence.
Can a business grow too fast
Yes. Strong sales growth sounds good until operations fall behind. I usually see the strain show up in stock availability, lead handling speed, onboarding capacity, fulfilment, or customer support.
That matters in digital marketing because paid search and SEO can increase demand faster than the business can absorb it. If service quality drops, conversion rates soften, refund pressure rises, and growth becomes expensive to maintain.
Should refunds and returns be included
Use net sales when the goal is to measure commercial performance, not top-line activity. That gives a clearer view of whether growth is holding after cancellations, refunds, and product issues are accounted for.
Consistency matters more than perfection here. If one period includes returns and another does not, the growth rate stops being useful for decision-making.
Which reporting period is best
The right reporting period depends on the decision in front of you. PPC managers often need a shorter view to spot changes in lead flow, cost efficiency, or revenue response after a campaign adjustment. Business owners and senior marketers usually need a broader trend line to judge whether growth is stable enough to support hiring, stock purchases, or budget increases.
For seasonal businesses, matched period comparisons usually give a better read than reacting to one strong or weak month.
What makes sales growth rate useful for SEO and PPC
Sales growth rate connects channel reporting to revenue. It shows whether gains in traffic, leads, and conversions are turning into business growth, or whether the channel is producing activity without enough commercial impact.
That makes it a useful KPI in marketing reports. It helps teams decide where to increase budget, which landing pages need conversion work, whether branded search is inflating results, and whether SEO growth is bringing in buyers or just visits.
If you want clearer reporting between ad spend, SEO performance, and sales outcomes, Click Click Bang Bang can help build the tracking, dashboarding, and campaign structure needed to turn sales growth rate into a working KPI instead of a number buried in a spreadsheet.
Read NeXt
Or Read Our Latest
Click. CLick. Subscribe.
Get our best PPC insights, industry updates, and power moves delivered straight to your inbox. No fluff, just high-caliber strategies that actually work.
Don’t Leave Just Yet
Try Us For 30-Days,
Risk Free!!
We guarantee that you’ll love our work within the first 30 days, if not you’ll get your money back.
What have you got to lose?