ROAS in Marketing: Maximize Profit in 2026
Last Updated

You’re probably in one of two situations right now. Either your campaigns are producing sales and leads, but someone above you wants proof that the spend is justified. Or the numbers look busy, clicks are coming in, reports are full of activity, yet profit still feels unclear.
That’s where roas in marketing stops being a dashboard metric and becomes a business control. If you use it properly, ROAS tells you which campaigns deserve more budget, which ones are flattering to deceive, and where your measurement is lying to you. If you use it badly, it turns into a vanity ratio that pushes spend into the wrong places.
Teams often don’t have a ROAS problem. They have a decision-making problem caused by incomplete tracking, shallow reporting, or a habit of chasing the highest ratio instead of the highest commercial return.
What Is ROAS and Why Does It Matter More Than Ever
A marketing manager rarely gets asked whether a campaign generated impressions. They get asked whether the spend produced revenue. ROAS, or return on ad spend, is the clearest way to answer that question.
At its simplest, ROAS measures how much revenue your ads generate relative to what you spend to run them. It matters because it connects media buying to commercial outcomes. Click-through rate can tell you whether an ad got attention. Conversion rate can tell you whether a page did its job. ROAS tells you whether the whole thing made financial sense.

Why vanity metrics break down
A campaign can look healthy on the surface and still be a poor investment.
- Cheap clicks can be expensive traffic if the audience never buys.
- High impressions can hide weak intent when reach expands faster than relevance.
- Strong conversion rate can still disappoint if average order value is too low.
- Lead volume can mislead B2B teams when low-quality enquiries clog sales pipelines.
This is why smart operators use ROAS as the checkpoint between media performance and business performance. It forces a harder conversation. Did the spend create revenue that justifies more spend?
ROAS is now harder and more important
ROAS has always mattered, but it matters more now because measurement is less clean. Privacy changes, platform black boxes, and cross-device buying journeys all make attribution noisier. When data gets messier, teams either become more disciplined or more vulnerable to bad decisions.
Practical rule: If leadership wants a budget answer, don’t open with clicks, CPMs, or engagement. Start with revenue efficiency.
If you want a concise refresher on the ROAS meaning in marketing, that resource is useful as a quick baseline. The bigger challenge is applying ROAS in practice, where channel data is incomplete and “good performance” depends on margin, offer quality, and customer value.
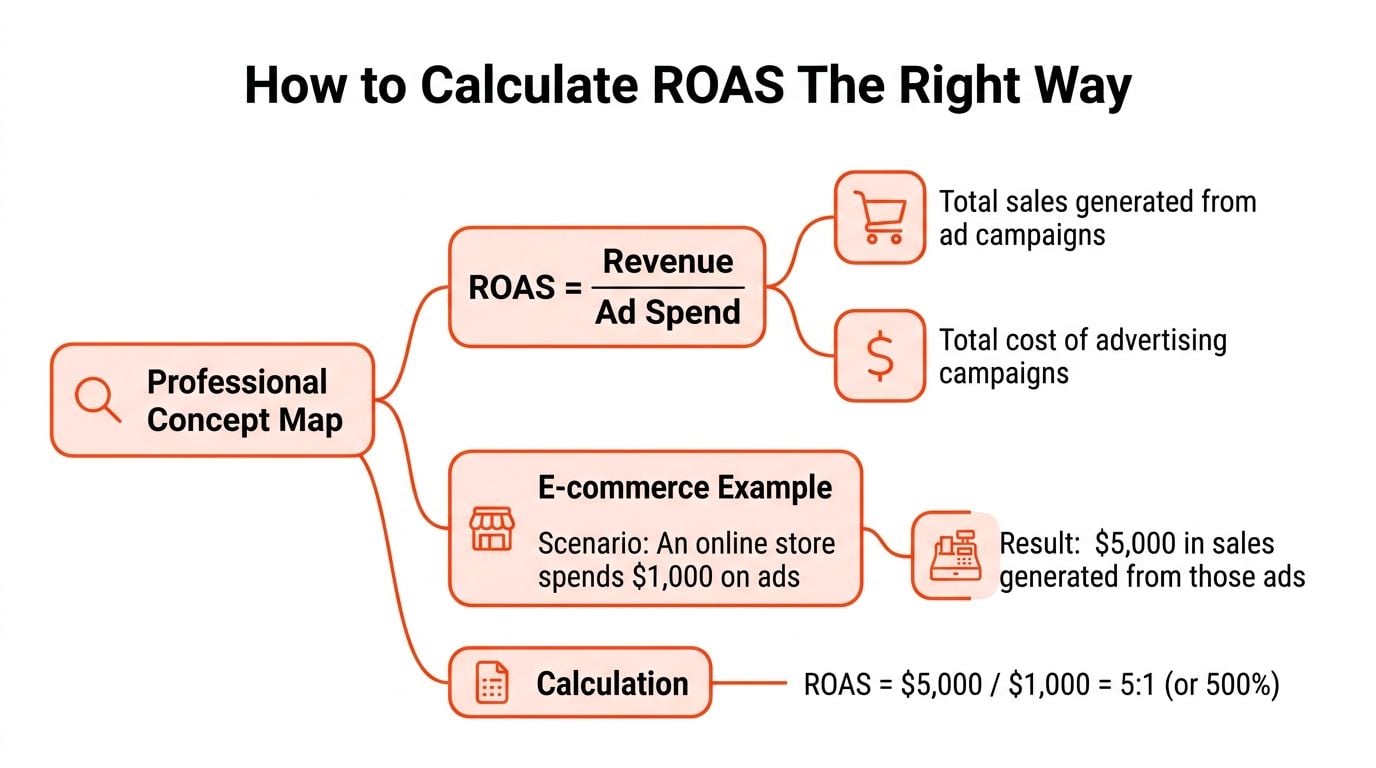
How to Calculate ROAS The Right Way
The basic formula is simple:
ROAS = Revenue / Ad Spend
If a campaign generates more revenue relative to what you spend, ROAS goes up. If revenue falls or spend rises faster than sales, ROAS drops. On paper, it’s one of the easiest metrics in paid media. In practice, the hard part is defining both sides of the formula accurately.
Start with the clean version
Use the simple formula first. It gives everyone a common language and helps teams compare channels without getting lost in spreadsheet noise.
Here’s the right way to set it up:
-
Define the revenue window
Match revenue to the same time period as the spend you’re evaluating. -
Define the spend clearly
At minimum, include platform spend. Later, add the hidden costs that distort “good” ROAS. -
Use attributed revenue, not total business revenue
If you run search, Meta, email, and direct traffic together, don’t dump all sales into one paid media calculation.
Break-even ROAS matters more than average ROAS
A lot of teams ask, “What’s a good ROAS?” The better question is, “What ROAS do we need to avoid losing money?”
Break-even ROAS = 1 / Gross Margin
That formula matters because revenue isn’t profit. If your margins are tight, a ratio that looks respectable can still be commercially weak. The article on return on ad spend calculator is useful here because it helps teams translate a ratio into an operating decision, not just a report number.
A ROAS target without a break-even point is just a preference.
Build a target ROAS from business reality
Once break-even is clear, set a target ROAS that reflects how the campaign functions.
For example, some campaigns are built for immediate sales. Others assist the path and convert later through brand search or remarketing. Your target should reflect the role of the campaign, the margin profile of the product, and whether the business is prioritising efficiency or growth.
That’s why one blanket target across Google Search, Google Shopping, Meta, and LinkedIn usually creates bad optimisation. Different platforms influence different stages of demand.
Use the decomposition formula to diagnose performance
ROAS demonstrates its utility beyond mere reporting. In the Australian market, e-commerce PPC on Google Ads and Meta typically benchmarks at 3:1 to 5:1, with top-performing campaigns hitting 6:1 or higher when AOV and CVR are strong, according to Sabino DB’s breakdown of ROAS. That same source frames ROAS through this decomposition:
ROAS = AOV × CVR × (CTR / CPM)
That formula is practical because it shows which lever is holding performance back.
Read the levers, don’t just read the final ratio
If ROAS is disappointing, the problem usually sits in one of these places:
-
AOV is too low
You may be converting buyers, but basket size doesn’t support the media cost. -
CVR is weak
Ad traffic might be relevant, but the landing page, offer, or checkout isn’t closing. -
CTR is soft
Creative or message match may be poor, especially in colder audiences. -
CPM is rising
Auction pressure can erase gains even when the rest of the funnel is stable.
A lot of wasted effort comes from fixing the wrong stage. Teams rewrite ads when the product page is the actual issue. Or they blame landing pages when broader targeting has pushed CPM up and intent down. The formula helps separate those problems.
What Is a Good ROAS Industry and Platform Benchmarks
A good ROAS isn’t universal. It depends on margin, sales cycle, repeat purchase behaviour, and channel role. A ratio that looks average for one business can be strong for another. The mistake is treating one benchmark as if it applies equally to branded search, prospecting on Meta, LinkedIn lead gen, and Shopping campaigns.
The Australian data points available show why context matters. On one hand, PPC/SEM campaigns delivered an average ROAS of 1.55 across 52 client campaigns analysed from 2019 to 2025, according to First Page Sage’s ROAS statistics. On the other hand, channel-specific e-commerce benchmarks can sit materially higher when the product, audience, and funnel are aligned.
Benchmarks are decision tools, not goals
Use benchmarks to set expectations, not to declare victory. If your account sits below a broad average, that doesn’t automatically mean failure. If it sits above one, that doesn’t automatically mean profit.
The internal reference on what is a good ROAS is useful for framing this properly: the benchmark only matters after you account for your own economics.
ROAS Benchmarks by Platform and Industry Australia 2026
| Platform | Industry | Average ROAS | High-Performer ROAS |
|---|---|---|---|
| PPC/SEM | Mixed campaigns across AU dataset | 1.55 | Qualitatively higher for strong operators |
| Google Ads and Meta | E-commerce retailers | 3:1 to 5:1 | 6:1 or higher |
| LinkedIn Ads | B2B | 2.30 in the cited AU dataset | Qualitatively higher when lead value is strong |
| Multi-platform PPC | AU B2B and e-commerce scaling | Minimum 2.8:1 break-even threshold after indirect costs | 4:1 for optimised campaigns in the cited analysis |
| Meta Instagram Shopping | E-commerce | 5.2:1 | Qualitatively higher in strong AOV categories |
| B2B lead generation | 3.1:1 | Qualitatively stronger when LTV supports higher CPC |
How to interpret those numbers
Three patterns matter.
First, Google Search and Shopping often look efficient because intent is already present. Someone is searching for a product or solution, so the platform harvests demand well. That tends to support stronger direct ROAS, especially for e-commerce.
Second, Meta often swings harder between excellent and poor performance. When the creative, offer, and remarketing structure are right, returns can be strong. When audience quality slips, spend can expand faster than revenue.
Third, LinkedIn needs to be judged differently. For many B2B teams, the click cost is higher and the path to revenue is longer. A lower front-end ROAS can still be rational if lead quality and downstream value hold up.
Don’t compare channels as if they all do the same job. Search captures intent. Social often creates or shapes it. LinkedIn qualifies it differently again.
The practical takeaway is simple. Don’t ask whether your ROAS is “good” in isolation. Ask whether it is good for that platform, for that offer, for that margin structure, and for that stage of the buying journey.
Tracking ROAS Accurately Across Your Marketing Channels
Most ROAS reporting is too clean to be trusted. The formula is neat. The customer journey isn’t.
A buyer might see an Instagram ad, click a Google Search result later, return through remarketing, then convert after a direct visit. If each platform claims the sale, your ROAS becomes inflated in some reports and understated in others. That’s how teams end up moving budget based on the wrong story.
![]()
Last-click is easy and often misleading
Last-click attribution survives because it’s easy to read. It tells you which touchpoint closed the sale. It doesn’t tell you which touchpoint created the opportunity.
That’s a serious problem when you run prospecting on Meta, demand capture on Google, and retargeting across both. Last-click usually over-rewards the channel that arrived last and undervalues the channel that introduced or warmed the buyer.
Australia-specific tracking problems are getting worse
Australian marketers have an added layer of complexity. Privacy laws, including the Privacy Act 1988, plus projected cookie deprecation impacts in 2025 and 2026, create attribution black holes that can lead to 20-30% underreported ROAS for e-commerce retailers, according to Improvado’s ROAS guide.
That underreporting matters because it changes budget behaviour. Upper-funnel campaigns often look weaker than they really are. Retargeting often looks stronger than it really is. Teams then cut prospecting too hard and wonder why remarketing pools dry up later.
What accurate tracking looks like in practice
If you want better ROAS decisions, fix the plumbing first.
-
Use consistent UTM structure
Campaign naming has to be disciplined across Google Ads, Meta, LinkedIn, email, and any partner traffic. -
Validate conversion actions
Don’t assume platform tags and GA4 events are aligned. Check form submissions, purchases, phone calls, and imported offline events. -
Pass revenue correctly
Purchase value needs to reach the ad platform and analytics layer with the right event mapping. -
Review duplicate credit
Platform-reported conversions and analytics-reported conversions won’t match perfectly, but major inflation needs investigation.
The practical starting point is effective website conversion tracking. Without that foundation, ROAS analysis becomes a media exercise rather than a business measurement exercise.
Use MER when channel attribution gets noisy
When attribution confidence drops, add MER, sometimes called blended ROAS, to your reporting view. MER looks at total revenue against total marketing spend. It won’t replace channel-level ROAS, but it gives you a reality check when platforms disagree with each other.
Here’s when MER helps most:
| Situation | ROAS view | MER view |
|---|---|---|
| One platform claims a surge | Useful for platform optimisation | Confirms whether total business revenue actually moved |
| Prospecting looks weak | Can undervalue upper-funnel influence | Captures broader commercial effect |
| Attribution is fragmented | Often incomplete | Gives a top-line efficiency read |
When tracking gets messy, don’t throw ROAS out. Pair it with a blended view so you can still make sensible budget calls.
The teams that handle this well don’t chase perfect attribution. They build a measurement model that is stable enough to guide decisions, then they keep testing it against actual business outcomes.
Actionable Strategies to Improve Your ROAS
Improving ROAS doesn’t start with a bid strategy. It starts with identifying which part of the system is failing. If your traffic is poor, better landing pages won’t save the account. If your traffic is strong but conversion is weak, more spend just buys more waste.
For Australian B2B and e-commerce brands running across Google Search, Meta, and LinkedIn, the cited break-even analysis shows a minimum 2.8:1 ROAS threshold once indirect costs are included, and that creative production can account for 10-15% of spend while untracked campaigns can overstate efficiency by 40%, according to Adobe’s guide to calculating ROAS. That’s why optimisation has to focus on commercial levers, not platform optics.

Improve conversion rate before you increase spend
When a campaign is close to viable, conversion rate improvements often boost ROAS faster than audience expansion.
Focus on:
-
Message match
Your ad promise and landing page headline should feel like the same conversation. -
Offer clarity
Buyers shouldn’t have to work out what they get, who it’s for, or what happens next. -
Friction removal
Cut unnecessary form fields, confusing navigation, and weak mobile layouts. -
Intent alignment
A Google Search ad for high-intent queries shouldn’t send traffic to a generic homepage.
The point isn’t to make pages prettier. It’s to make them easier to say yes to.
Raise AOV where the economics allow it
If traffic quality is good and conversion is acceptable, the next lever is average order value. This is especially relevant in e-commerce, where media costs can be stable while basket size moves.
Try a mix of:
- Product bundles that make buying the complete solution easier.
- Upsells at the product page rather than waiting until checkout.
- Cross-sells after add-to-cart where the add-on is clearly relevant.
- Tiered offers in B2B, where the higher-value option is structured as the sensible default.
AOV is often the least discussed ROAS lever and one of the most commercially important.
Tighten traffic quality instead of just cutting spend
Low ROAS doesn’t always mean the budget is too high. Sometimes the audience is too broad or the search terms are too loose.
In Google Ads, review search term quality, negative keyword coverage, and whether broad traffic is being pushed beyond commercial intent. In Meta, separate remarketing from prospecting, and don’t let blended campaign reporting hide which audience bucket is carrying the account. In LinkedIn, check whether job function, seniority, and company filters match the sales brief.
Better ROAS usually comes from better exclusion, not just better expansion.
Refresh creative with intent, not volume
Creative fatigue is real, but random creative churn isn’t a strategy. Test angles, not just assets.
For example, one variation might push urgency. Another might focus on proof. Another might simplify the value proposition for colder traffic. Tools that speed up creative concepting can help, especially when teams need multiple ad variants quickly. For visual experimentation, something like AI face merge can be useful in certain creative workflows where you’re developing ad mockups or testing visual styles before production.
A practical walkthrough on campaign optimisation is worth watching before you start changing too many levers at once:
Work with a reporting setup that shows profitable segments
If your reporting only shows account-level ROAS, you’ll miss where profit lies. Segment by campaign intent, audience temperature, product category, device, and geography. That’s where actionable differences usually appear.
One option for teams that want managed execution across Google, Meta, and LinkedIn is Click Click Bang Bang, which provides live reporting, platform integration, and conversion tracking as part of PPC management. The important point isn’t the provider. It’s the operating model. You need a setup that makes it obvious which segments deserve more budget and which should be restricted or rebuilt.
Moving Beyond ROAS With LTV and CAC
ROAS is powerful, but it can still lead you into bad decisions if you treat the first purchase as the whole story. Some campaigns produce excellent front-end ROAS and still attract weak customers. Others look modest at first but bring in buyers who spend again, stay longer, or convert into higher-value accounts later.
That’s where LTV and CAC matter.
When high ROAS is the wrong goal
A campaign can deliver strong initial sales efficiency while creating poor long-term value. The Australian angle here is important. The cited Northbeam summary notes that Google Shopping in Australia can show an average short-term ROAS of 4.2x, while 55% of Australian online retailers report churn rates above 40% after PPC acquisition in the referenced data set from Northbeam’s guide to ROAS.
That’s the trap. A high ratio on day one can hide a weak customer cohort on day ninety.
LTV changes what “good” looks like
If one campaign brings in buyers who reorder, subscribe, or buy higher-margin products later, you can justify a lower initial ROAS. If another campaign attracts discount-driven one-time buyers, you may need a much stronger front-end return just to make the economics work.
A sensible way to think about this is:
- ROAS tells you whether the ad worked now
- CAC tells you what it cost to acquire the customer
- LTV tells you whether acquiring that customer was worth it over time
That combination leads to better scaling decisions than ROAS alone.
Use cohort thinking, not just campaign thinking
Instead of asking only which campaign produced the highest ROAS, ask which campaign produced the best customer cohort. For e-commerce, that might mean repeat purchase behaviour and contribution margin over time. For B2B, it might mean lead-to-opportunity quality, sales velocity, and account expansion potential.
This changes how you allocate budget. A pure ROAS lens pushes money toward campaigns that close easiest. An LTV-aware lens can justify more investment in campaigns that bring better customers, even if the front-end ratio looks less impressive.
Good media buying doesn’t just buy conversions. It buys the right customers.
Reporting ROAS Effectively to Stakeholders
Most ROAS reporting fails because it answers the wrong question. Stakeholders don’t only want to know what happened in-platform. They want to know whether spend turned into commercial value.
What leadership actually needs
A CMO or founder usually doesn’t need every audience breakdown. They need a short, credible narrative:
- What we spent
- What revenue or qualified pipeline it drove
- Whether that cleared the required efficiency threshold
- What we’re scaling, reducing, or testing next
The marketing team, by contrast, needs the underlying detail. Which campaign types held efficiency. Which audience pools deteriorated. Which creative angles improved results. Same account, different reporting depth.
A simple reporting structure that works
Use a top section with business impact, then a second layer with channel analysis, then a short action plan.
A clean stakeholder update usually includes:
| Reporting layer | Focus |
|---|---|
| Executive summary | Spend, revenue impact, efficiency trend, next decision |
| Channel view | Search, Meta, LinkedIn, remarketing, prospecting |
| Diagnostic notes | Tracking issues, attribution caveats, conversion quality |
| Action list | Scale, pause, rebuild, test |
Keep the tone direct. If attribution is incomplete, say so. If a campaign looks efficient but volume is limited, say that too. ROAS reporting is most useful when it helps leadership make a decision with confidence.
Frequently Asked Questions About ROAS
What’s the difference between ROAS and ROI
ROAS measures revenue generated from advertising relative to ad spend. ROI looks at profit after broader business costs are considered. A campaign can have positive ROAS and still produce poor ROI if margins, fulfilment costs, labour, or overhead erase the gains.
What should I check first if ROAS is low
Start with a short diagnostic list:
- Tracking accuracy so you know the revenue number is credible
- Search terms or audience quality to confirm the right people are clicking
- Landing page conversion friction such as weak offer clarity or poor mobile experience
- Average order value or lead quality so you don’t optimise for low-value wins
- Hidden costs including creative, management, and platform-related operational costs
Can high ROAS still lose money
Yes. This happens when the ratio looks good but the margin structure is weak, the attributed revenue is inflated, or the customers acquired don’t produce enough downstream value. It also happens when teams ignore non-media costs and treat platform spend as the full denominator.
Should every campaign be judged by the same ROAS target
No. Branded search, remarketing, prospecting social, Shopping, and LinkedIn lead gen all play different roles. A single target usually rewards demand capture and punishes demand creation. Judge campaigns according to margin, objective, and their place in the buying journey.
If you want help turning ROAS from a report metric into a profit metric, Click Click Bang Bang can help you structure tracking, audit campaign efficiency across Google, Meta, and LinkedIn, and build a clearer view of where your ad spend is making money.
Read NeXt
Or Read Our Latest
- SEO Cost Australia 2026: Your Guide to Pricing
- Offline Conversion Tracking: Guide for AU Businesses 2026
- How to Start Advertising on LinkedIn: 2026 Guide
- 7 B2B LinkedIn Ad Examples to Steal in 2026
- 7 Best Google Ads Managers in Australia for 2026
- Customer Data Platform Guide: Boost ROI & Meet AU Privacy
Click. CLick. Subscribe.
Get our best PPC insights, industry updates, and power moves delivered straight to your inbox. No fluff, just high-caliber strategies that actually work.
Don’t Leave Just Yet
Try Us For 30-Days,
Risk Free!!
We guarantee that you’ll love our work within the first 30 days, if not you’ll get your money back.
What have you got to lose?