

What Is ROAS in Digital Marketing Explained
Last Updated
When you get right down to it, Return On Ad Spend (ROAS) is the simplest, most direct way to figure out if your ads are actually making you money. It tells you exactly how much revenue you're earning for every single dollar you put into your campaigns.
Think of it like this: for every dollar you feed into the advertising machine, ROAS is the number that tells you how many dollars came out the other side. Simple as that.
What ROAS Really Means for Modern Marketers
At its heart, ROAS answers the one question every business owner asks: are we wasting money on these ads? It cuts straight through the fluff—things like clicks, impressions, and likes—to focus on what truly matters: the financial return.
This kind of clarity is absolutely essential for making smart, data-backed decisions about where to put your marketing budget.
I like to think of an ad budget as fuel for a revenue-generating engine. If that's the case, ROAS is the fuel efficiency gauge. A high reading tells you you’re getting fantastic mileage from your spend. A low reading? That’s your signal that it’s time to pop the bonnet and figure out what needs a tune-up.
To break it down even further, here's a quick look at the core components of ROAS.
ROAS at a Glance
| Component | Description | Example |
|---|---|---|
| Revenue from Ads | The total sales value generated directly by your advertising campaigns. | A Google Ads campaign drove AU$4,000 in online sales. |
| Cost of Ads | The total amount you spent to run those specific advertising campaigns. | The Google Ads campaign cost AU$1,000 to run. |
| ROAS Calculation | Revenue divided by Cost. It’s usually expressed as a ratio (e.g., 4:1) or a number (4). | AU$4,000 / AU$1,000 = 4 (or 4:1) |
This table shows just how straightforward the concept is. It's a powerful metric because it's grounded in real financial outcomes, not just marketing activity.
The Simple Formula Behind ROAS
You don't need a degree in advanced mathematics to calculate your ROAS. All it takes is two numbers: the total revenue you made from your ads and how much you spent on them.
ROAS = Total Revenue from Ads / Total Cost of Ads
So, let's say you spent AU$1,000 on a Google Ads campaign, and it brought in AU$4,000 in sales. Your ROAS would be 4:1.
That means for every dollar you invested, you got four dollars back. It’s an incredibly powerful way to see the direct financial impact of your campaigns.
Why ROAS Is Such a Critical Metric
For any business that's serious about growth, tracking ROAS isn't just a good idea—it's non-negotiable. It gives you the cold, hard proof you need to justify your marketing budget and show stakeholders that your ad spend is pulling its weight.
Here in Australia, that focus on measurable outcomes is more important than ever. With local digital ad spending projected to rocket past AU$31 billion by 2025, the competition is getting fiercer by the day. In this environment, ROAS has become a leading indicator of whether a campaign is a winner or a dud. You can dig into more insights on Australian advertising trends to see just how competitive the market is getting.
Specifically, ROAS helps you:
- Allocate Budgets Wisely: You can quickly spot which campaigns are delivering the goods and funnel more of your budget towards what's actually working. No more guesswork.
- Optimise Underperforming Ads: A low ROAS is your early warning system. It flags the campaigns that need an overhaul or should be shut down before they burn through more of your cash.
- Drive Strategic Growth: By consistently aiming to improve your ROAS, you're ensuring your marketing spend isn't just another business expense. It becomes a profitable investment in your company's future.
How To Calculate Your ROAS Accurately
On the surface, the ROAS formula—Revenue divided by Cost—seems simple enough. But its accuracy, and its real value to your business, depends entirely on the numbers you plug into it. To get a true picture of your campaign's profitability, you need to look beyond the basic ad spend figure your platform dashboard spits out.
If you only use the ad spend from Google or Meta, you’re getting a dangerously inflated sense of performance. It’s a vanity metric that can lead you to make some really poor budgeting decisions down the track.
A more honest and useful calculation involves adding up all the costs that go into making your campaigns happen.
Identifying Your Total Ad Costs
Your Total Ad Costs are much more than what you pay the ad platform directly. A comprehensive view includes every dollar spent to get your ads live, managed, and running effectively. This means you need to dig a little deeper than the dashboard.
Think about these common "hidden" costs:
- Agency or Freelancer Fees: The management fees you pay your PPC agency or specialist.
- Creative Production: Any costs for graphic design, video creation, or copywriting.
- Third-Party Tools: Subscriptions for software you use for analytics, bidding, or tracking.
- Affiliate Commissions: Payouts to partners or influencers who helped drive sales through your ads.
Ignoring these expenses might make your numbers look better, but it's not a true measure of profitability. If you want a quick and easy way to factor in these variables, our Return On Ad Spend calculator can help you get a much more accurate result.
By accounting for all related expenses, you shift from simply measuring ad platform efficiency to evaluating the genuine financial return of your entire marketing effort. This is the difference between knowing if an ad is working and knowing if it's actually making you money.
A Practical Calculation Example
Let's walk through a relatable scenario. Imagine an Australian e-commerce business that sells handmade leather goods. They've just run a Google Shopping campaign for a month and want to calculate their true ROAS.
First, they pull together all their revenue and cost data:
- Total Revenue from Ads: They generated $15,000 in direct sales.
- Google Ads Spend: The platform cost was $3,000.
- Agency Management Fee: They paid their PPC agency $750 for the month.
- Photography Costs: New product photos specifically for the ads cost $250.
Now, let's work out their Total Ad Costs:
$3,000 (Ad Spend) + $750 (Agency Fee) + $250 (Photography) = $4,000
With that accurate cost figure, we can calculate their true ROAS:
ROAS = $15,000 (Revenue) / $4,000 (Total Costs) = 3.75
This means for every single dollar they invested in the entire campaign effort, the business generated $3.75 in return.
Had they only used the $3,000 ad spend figure, their ROAS would have appeared to be 5:1—a significantly different and misleading result. This more precise approach gives them the clarity they need to make strategic decisions with real confidence.
Why ROAS Is a Strategic Business Metric
Thinking of ROAS as just another calculation is missing the point entirely. It’s not a simple number; it's the strategic compass for your entire business. It’s what turns your advertising from a hopeful expense into a predictable, revenue-generating engine.
Once you truly get what ROAS is, you can finally justify marketing budgets with hard numbers. You can pinpoint your most profitable campaigns with surgical precision and know exactly where to pump more ad spend for maximum impact. It takes the guesswork out of growth.
From Blind Spending to Strategic Scaling
Let’s imagine two businesses. They each spend $500,000 on ads. Business A is spending blindly, chasing vanity metrics like clicks and impressions. Business B, on the other hand, tracks its ROAS meticulously, constantly shifting its budget toward the campaigns that deliver the highest return.
The infographic below shows a pretty common outcome in this exact scenario.
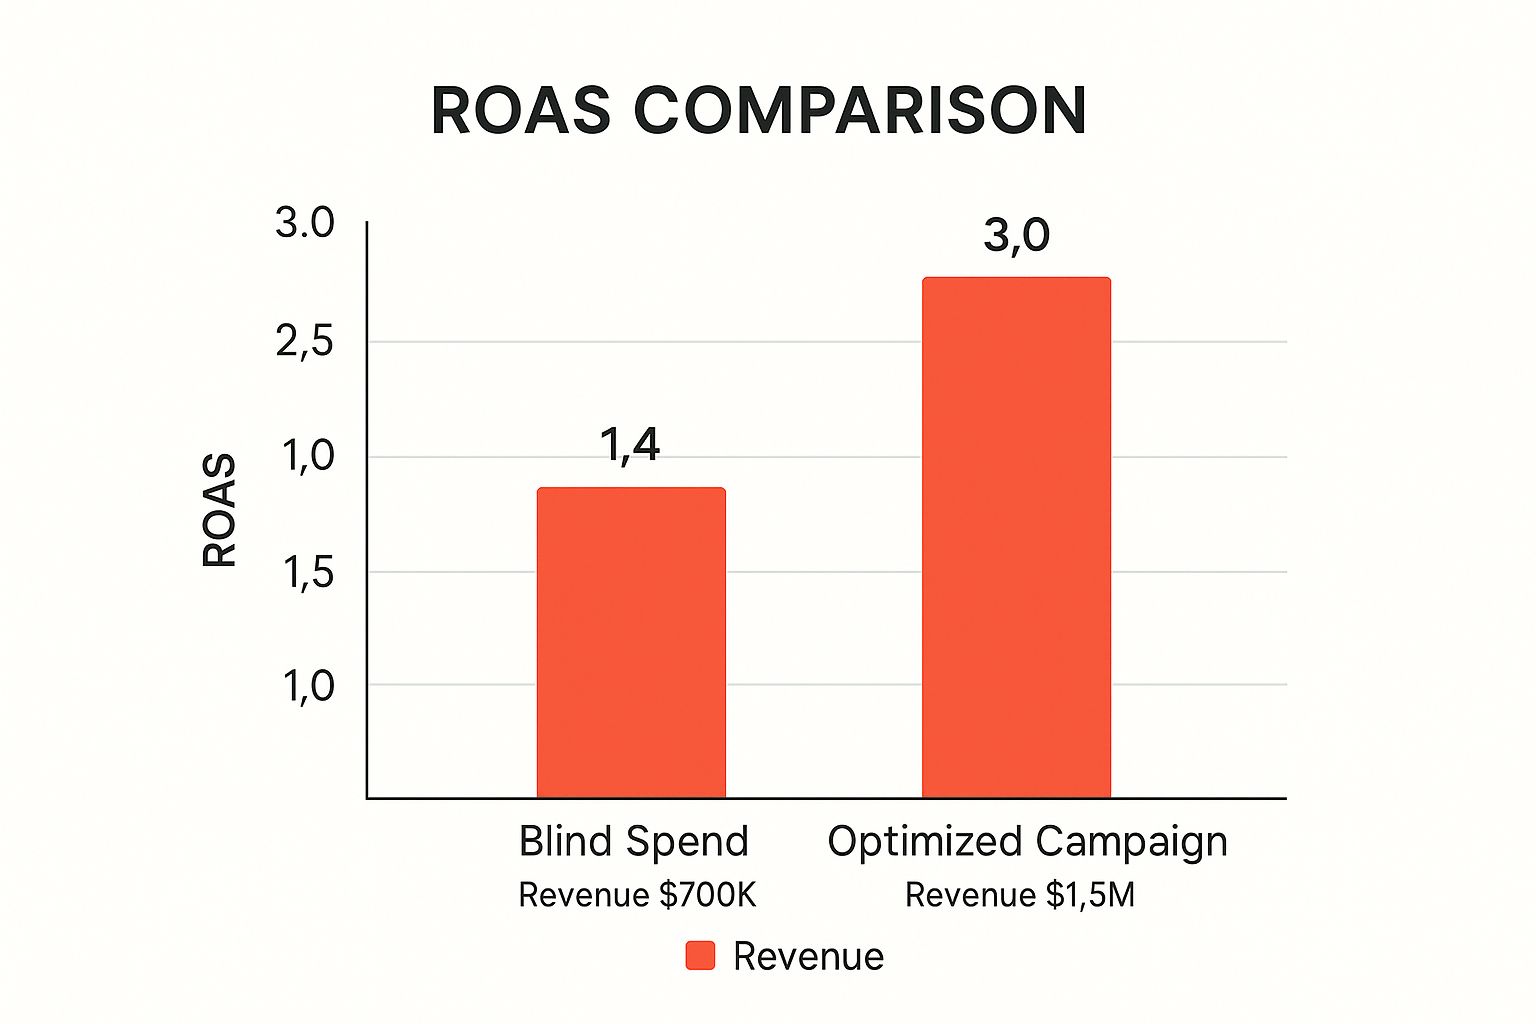
As you can see, the optimised campaign pulls in more than double the revenue from the same ad spend. That’s the strategic power of ROAS in action. It’s not about spending more; it’s about spending smarter.
This sharp focus on data-driven optimisation is what separates campaigns that just tread water from those that fuel sustainable growth. It proves marketing's direct contribution to the bottom line, making it a non-negotiable part of your business strategy. If you want to dig deeper into this, check out our guide on how to measure advertising effectiveness.
ROAS elevates the conversation from "How much are we spending?" to "How much are we earning from that spend?" It’s the metric that connects your marketing activities directly to your business’s financial health and long-term success.
Ultimately, ROAS gives you the clarity needed to navigate the competitive advertising space. Delving into specific performance data, like with AI Revenue Analytics for YouTube and TikTok Creators, only reinforces why ROAS is such a critical business metric.
By making ROAS a priority, you gain the ability to:
- Justify Marketing Spend: Present concrete evidence to stakeholders that the marketing budget isn't a cost but a profitable investment.
- Identify Winning Campaigns: Quickly see which channels, audiences, and creative elements are actually driving the best results.
- Fuel Sustainable Growth: Make informed decisions on where to reinvest profits for scalable and predictable expansion.
Setting Realistic ROAS Benchmarks
“What’s a good ROAS?” It’s one of the first questions clients ask, and the honest answer is always a bit frustrating: it depends entirely on your business.
There’s no magic number, no universal benchmark that fits everyone. The real measure of a “good” ROAS is dictated by your own financial structure. Things like your profit margins, industry, and overall business costs are what truly define success.
A high-margin business selling software might be thrilled with a 3:1 ROAS. But for a low-margin retailer, a 10:1 ROAS might be the bare minimum just to break even. This is why chasing a generic industry average can send you down the wrong path. Your target needs to be custom-built for your business model and profitability goals.
Figuring out what a good ROAS looks like for you is the first, most critical step toward making smart advertising decisions.
Why Profit Margins Dictate Your Target
The single most important factor shaping your ROAS target is your profit margin. This is what’s left of your revenue after you’ve paid for the goods you sold and other direct costs. Think of it as the financial cushion you have to cover ad spend and still walk away with a profit.
A business with an 80% profit margin can afford to be profitable at a lower ROAS, simply because there's more revenue left over from each sale. On the flip side, a business with a tiny 20% margin has to hit a much higher ROAS because most of the revenue is already eaten up by costs.
This is exactly why you can't just borrow another company's target. Your break-even point—the ROAS you need just to cover your costs without losing money—is completely unique to your numbers. Anything you make above that is pure profit. We actually have a detailed guide that dives deeper into what is a good ROAS based on these individual factors.
How Industry and Channel Averages Vary
While your own margins are the top priority, it’s still helpful to look at industry and channel data for context. It gives you a feel for the competitive landscape and what kind of returns are typical across different platforms.
Recent data on Australian advertising performance shows just how much these benchmarks can swing. Performance doesn’t just vary by industry; it changes dramatically depending on the specific advertising channel you’re using.
Let's look at some of the typical ROAS figures we see across different channels.
Average ROAS Benchmarks by Channel in Australia
| Marketing Channel | Average ROAS |
|---|---|
| PPC/SEM | 1.55 |
| Facebook Ads | 1.80 |
| LinkedIn Ads | 2.30 |
| Influencer Marketing | 3.45 |
| SEO | 9.10 |
As you can see, the returns can be all over the place. What's really interesting is that organic channels like SEO often pull in much higher returns on paper. You can dig into more of these figures and how they stack up in this in-depth ROAS statistics report. This data makes a strong case for a multi-channel strategy, as you'll likely see very different ROAS results depending on where you invest your budget.
Ultimately, setting a realistic benchmark is a balancing act. It requires looking inward at your own numbers while also looking outward at the market. This dual focus is the key to setting targets that are ambitious enough to drive real growth but grounded enough to ensure you’re actually making money.
Actionable Strategies to Improve Your ROAS

Knowing your numbers is the starting line. Turning those insights into action is how you win the race.
Improving your ROAS isn't about finding a single magic bullet. It’s about making a series of smart, strategic tweaks across your entire campaign. From the audience you target to the final click on your landing page, every single element plays a part.
Focusing on these key areas can transform a campaign that's barely breaking even into a seriously profitable revenue stream. Let's break down the practical strategies you can use right now to get a better return from every ad dollar you spend.
Refine Your Audience Targeting
The fastest way to burn through your ad budget is by showing ads to the wrong people. Simple as that. The more precisely you can define and reach your ideal customer, the less money you'll waste on clicks that were never going to convert anyway. Getting this right is the foundation of a healthy ROAS.
Start by digging into your existing customer data. Who are your most profitable customers? What are their demographics, interests, and online behaviours? Use this intel to build highly specific audiences and lookalike models on platforms like Meta and Google.
- Exclude Low-Intent Audiences: Actively create exclusion lists to stop your ads from showing to people who are unlikely to buy. This could be past converters (for certain campaigns) or demographics that have historically shown zero engagement.
- Leverage Retargeting: This one’s a no-brainer. Connect with users who have already shown interest—people who visited your site or abandoned a cart. These warm leads are often much cheaper to convert, giving your ROAS a significant and immediate boost.
- Test and Iterate: Never set and forget your audiences. You should be constantly testing new segments and refining your targeting based on performance data to keep your campaigns lean and efficient.
Optimise Ad Creative and Copy
Think of your ad creative as your digital shopfront. If it doesn’t grab attention and communicate value in a split second, potential customers will scroll right past without a second thought. Even tiny improvements in your ad’s click-through rate (CTR) can have a massive impact on your final ROAS.
A/B testing is your best friend here. You need to systematically test different elements to see what truly resonates with your audience.
A great ad makes the user feel understood. It speaks directly to their pain points and presents your product as the clear solution. This connection is what drives high-quality clicks and, ultimately, higher revenue.
Create variations of your ads to test things like:
- Headlines: Try different hooks. Pit a direct, benefit-driven headline against a more curious, question-based one and see which wins.
- Visuals: Test static images against short video clips or carousels. Does lifestyle imagery perform better than clean product shots on a white background? Find out.
- Call-to-Action (CTA): Experiment with different CTA text. Does "Shop Now" outperform "Learn More" or "Get Your Quote"? The data will tell you what drives the most action.
Enhance the Post-Click Experience
Getting the click is only half the battle. If your landing page is slow, confusing, or doesn't deliver on the promise of your ad, you’ve just paid for a click that will go nowhere. You'll lose the sale. The journey from the ad to the final conversion needs to be as seamless and friction-free as possible.
This focus on performance is stronger than ever, with 54% of buyers planning to increase their budgets for performance advertising in 2025. Marketers are doubling down on strategies that prove their worth with hard numbers, which is why optimising your entire funnel—not just the ad itself—is so critical.
To really drive a better ROAS, you should be laser-focused on improving conversion rates on your key landing pages. Make sure your page loads lightning-fast, the messaging perfectly matches the ad creative, and the path to purchase is blindingly obvious, especially on mobile devices.
ROAS FAQs: Your Common Questions Answered
Even when you've got the basics down, a few tricky questions about ROAS always seem to come up. It's usually the grey areas—the subtle differences between similar-sounding metrics or how ROAS behaves in the real world—that cause the most confusion.
Let's tackle some of the most common head-scratchers. Nailing these details is what separates a good campaign manager from a great one, giving you the confidence to make sharp, data-backed decisions.
What Is the Difference Between ROAS and ROI?
This is a big one. While ROAS and ROI both talk about profitability, they operate on completely different scales. Think of ROAS as a precision tool for a specific job, while ROI is the blueprint for the entire project.
ROAS is a campaign-level metric, plain and simple. It looks purely at the gross revenue you get back for every dollar you spend on ads (Revenue ÷ Ad Spend). Its only job is to tell you if a specific advertising effort is pulling its weight in generating sales.
ROI (Return on Investment), on the other hand, is a much bigger, business-level metric. It measures your total net profit against the total cost of the whole operation, calculated as ((Net Profit ÷ Total Cost) x 100). That "total cost" includes your ad spend, sure, but it also bundles in everything else: salaries, software, rent, the cost of the products themselves—the lot.
Key Takeaway: ROAS tells you how good your ads are at making the phone ring (generating revenue). ROI tells you how much of that money you actually get to keep after paying all the bills.
Can You Have a High ROAS and Still Lose Money?
Absolutely. And it’s a painfully common trap for businesses that haven't got a firm grip on their profit margins. Seeing a high ROAS number can give you a false sense of security, but it doesn't automatically mean you're making money.
Let’s say you’re celebrating a 4:1 ROAS. On paper, that looks brilliant. You're making $4 in revenue for every $1 you put into your ads. But if your margins are razor-thin, you could be heading for trouble.
Let's pull apart that $4 of revenue from a single sale:
- Cost of Goods Sold: $2.50
- Shipping & Handling: $0.75
- Ad Spend: $1.00
- Total Costs: $4.25
In this scenario, despite your "good" ROAS, you're actually losing $0.25 on every single sale that ad brings in. Ouch.
This is precisely why you must calculate your break-even ROAS. It’s the magic number you need to hit just to cover every cost associated with getting that product out the door. Anything above your break-even ROAS is actual, real-life profit in your pocket.
How Does Customer Lifetime Value Change ROAS?
Bringing Customer Lifetime Value (CLV) into the picture completely changes the game. It elevates ROAS from a short-term snapshot of a single transaction to a long-term strategic compass, especially for businesses built on repeat customers.
A campaign might have a pretty mediocre ROAS on the very first purchase—maybe it's even hovering below your break-even point. Based on that first look, you’d probably call it a failure and switch it off.
But what if that same campaign is attracting high-quality customers who come back and buy again and again over the next year? The total revenue generated from that initial ad spend keeps climbing long after the campaign has ended. The story changes completely.
For businesses with subscription models, loyal customer bases, or products that encourage frequent repurchasing, folding CLV into your analysis is non-negotiable. It gives you the confidence to spend a bit more to acquire a new customer, because you know their long-term value will deliver a much healthier—and far more accurate—return down the track.
At Click Click Bang Bang, we help you look beyond surface-level metrics to find what's truly driving profit in your campaigns. We build data-driven PPC and SEO strategies that focus on sustainable growth and maximising your real return. https://clickclickbangbang.com.au
Read NeXt
Or Read Our Latest
- How to Set Up Google Ads in Australia: Complete 2026 Guide
- Google Merchant Center Setup: The Complete 2026 Guide
- Business Manager Setup Facebook: The Complete 2026 Guide
- Google Ads Account Setup: Expert Guide for 2026
- Search Ads Optimisation: A Practical Guide for 2026
- Manual vs Automated Bidding for PPC Success
Click. CLick. Subscribe.
Get our best PPC insights, industry updates, and power moves delivered straight to your inbox. No fluff, just high-caliber strategies that actually work.
Don’t Leave Just Yet
Try Us For 30-Days,
Risk Free!!
We guarantee that you’ll love our work within the first 30 days, if not you’ll get your money back.
What have you got to lose?